|
|
Free Lessons Courses Seminars |
TechHelp Fast Tips Templates |
Topic Index Forum ABCD |
|
||||||
|
|
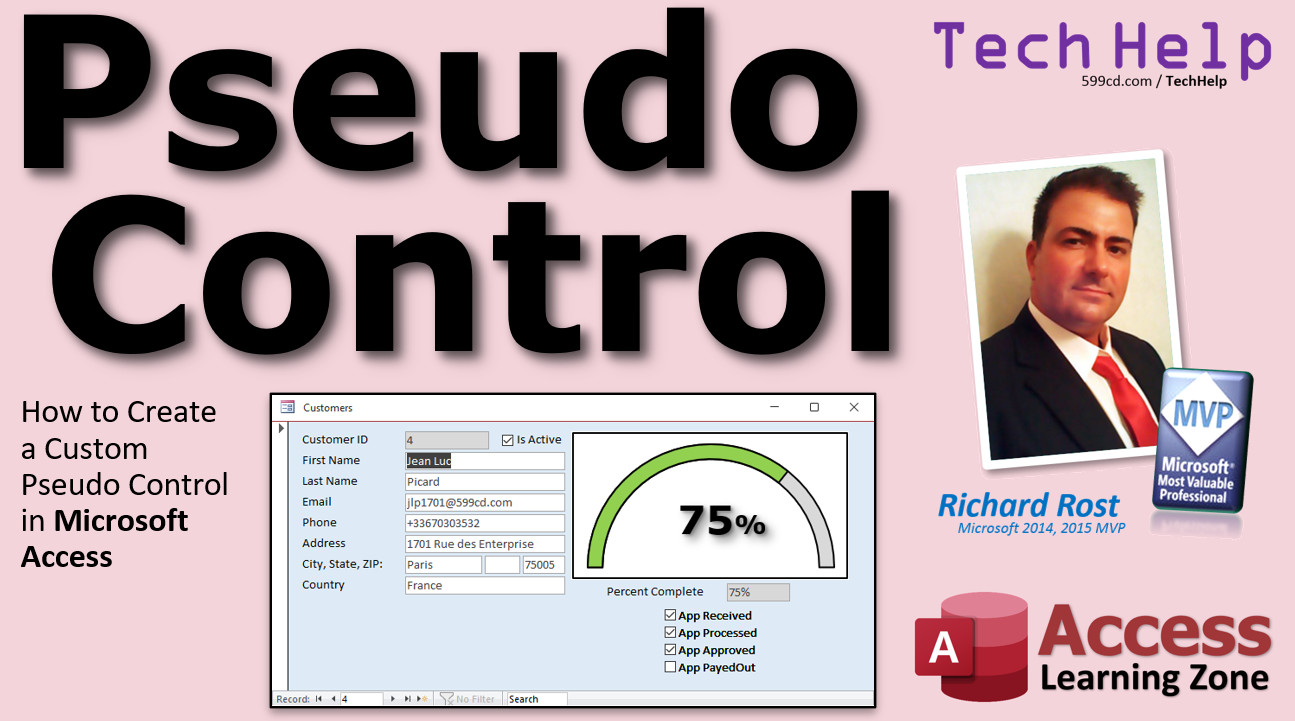
Pseudo Control By Richard Rost Create a Custom Pseudo Control: Arched Meter In this video, I will show you how to create the appearance of a custom control in Microsoft Access. We will use multiple overlapping images to create an arched meter control to display the percent of completion of a process. James from Pelham, Georgia (a Gold Member) asks: I am designing a dashboard form for my company jobs. I was wondering if there's a way to display the job's completion percentage like an arched meter? MembersMembers will learn how to use the control with a VBA loop. We'll see how to make the control itself clickable so users can change the value with your control. We'll also prevent the user from marking step 2 complete before step 1 is done.
Silver Members and up get access to view Extended Cut videos, when available. Gold Members can download the files from class plus get access to the Code Vault. If you're not a member, Join Today!
Links
Keywordsmicrosoft access, ms access, ms access tutorial, #msaccess, #microsoftaccess, #help, #howto, #tutorial, #learn, #lesson, #training, #database, How to create a control in access, customcontrol, arch meter, arched meter
TranscriptWelcome to another TechHelp video brought to you by AccessLearningZone.com. I am your instructor, Richard Rost. In today's video, I'm going to show you how to build a custom pseudo control in Microsoft Access.Today's question comes from James in Pelham, Georgia, one of my gold members. James says, I am designing a dashboard form for my company Jobs. I was wondering if there's a way to display the Jobs Completion percentage like an arched meter. And there's a copy of the image that James posted in my forums to give me an idea of what he's talking about. Now, yes, James, we can definitely do something that will look like this in Microsoft Access. There isn't an arched meter control, but we can build one. Now, why do I call this a pseudo control? Well, developing an actual control involves lots and lots of programming, and it's a topic way beyond today's video. If you go to form design, go to the control box, you'll see there are ActiveX controls. I've done videos on things like the Microsoft Progress Bar control. Those are actual controls that are in files that Microsoft and other third-party vendors provide, that you have to install into Access to use them. They're not part of Access. What we're going to do today is to create a pseudo control. It's going to be something that looks and behaves like it's a real control, and your end user won't know the difference. The benefit is that it's made 100% from standard Access objects. You don't have any extra files that you have to make sure get distributed with your Access database for your users to use them. I've mentioned in a lot of my previous videos that using outside controls, even things like the progress bar, sometimes when they change versions, things get messed up. If they have different versions of Office installed on their computers than you have on yours, you might have problems. I like building pseudo controls myself whenever possible. Even in my progress bar video, I show you how to make an alternative to Microsoft's progress bar because I like to keep stuff inside of Access. So, how do we build something like this, the arched control? Well, this is just basically going to be a series of overlapping images. Let's say we have an application process. We've got application received, processed, approved, and paid out. There are four steps, so you need four steps in your progress meter. We've got 0, 25, 50, 75, and 100. We're going to need five different images: 25, 50, 75, 100, and then one for 0, which I made my logo, of course. As each step of this process is completed, the progress bar will be updated. See that: 25, 50, 75, and 100. You can make more steps if you want to. As many images as you want to overlay, that's up to you. You want to do one for 10, 20, 30, 40, every five. That's completely up to you. I just did four steps for mine. Now, before we get started, I have some prerequisites for you. First, go watch my progress bar video. I show you how to create your own progress bar. That will help you when we build this one. You're going to need to know how to make calculated fields, calculated query fields. That's where you take one field that's based on the values in other fields. This is a more advanced video, so you will need to know some VBA. Go watch my intro to VBA. It's free. All these are free videos. They're on my website. They're on my YouTube channel. Go watch these first. Some videos are going to be more advanced, some basic. This is a little more advanced. You will need to know the After Update event and the On Current event. Go watch all five of these videos first and then come back to this one, and we'll move forward. So, how do you build these images first? I just used PowerPoint for mine. I like PowerPoint. I use it for my slides for these videos. You can use Word, Excel, or whatever graphic program you have. This isn't hard to do. In PowerPoint, I just go up to Insert, Shape, grab a box, draw a box down here, then you change the shape outline. It can be black, that's fine. The shape fill, make white or whatever background color you want. Then for the arch, I used Insert, Shapes, and there is an arch. Draw that on here, resize it so it fits perfectly. One of these lets you change the amount that's highlighted. Just like that. It took me a bit. I'm not much of an artist, I'll be honest with you. But then I made a gray one in the background and then there's a red one on top of it. You can change the percentage by just sliding this. You just have to get it to line up right. And then this part is just a simple bit of text. Just insert a text box, brought over here, and put in 5. Change the font, change all the other good stuff. That's pretty simple and straightforward. I put a shadow behind it so it looks neat. If you want to put little tick marks in here, go ahead. However much time you want to spend on these images is up to you. I just did a couple of them for a quick video to show you how to do this. But you can put little marks on here, you can put more, you want 5, 10, 15, 20, whatever. It's up to you. Remember, my goal with these videos is to show you basically how to do something. I'll give you the steps to get started. I can't show you everything there is to know about everything in one simple video, but this should at least get you started. So, make these. Now save these as images, or you can copy and paste them. I like to use a screen grab tool. I use HyperSnap. You can use the Windows Snip and Sketch tool if you want to. You can grab a piece right off the screen. I have a whole video on how to do that. I'll put a link down below in the link section if you don't know how to do a screen capture. Save this file. I'm going to get rid of this stuff down here because I don't need it. Now let's go over to our database. Here I am in the TechHelp free template. This is a free download. You can grab it off my website if you want to. There's a link down below in the link section. Or you can use any database that you want. Let's say we've got our customer form here. Just like you saw in my database, there's a four-step application process. The first thing I'm going to do is put four fields in my table to track how far along in this process this person is. Open customerT, right-click, Design View. Come down to the bottom. I've got the four steps: application received (yes/no), application processed (yes/no), application approved (that's the one you want to get to), and then application paid out. I don't know, loan application, whatever kind of application you're doing, insurance payments, whatever. For any four-step process, however many steps you need. Save that. The default value should be no for each one of these. Make sure the default value is no. Now let's go to the customer form. Let's start by putting those four checkboxes on the form. I'm going to get rid of all this stuff we don't need, just to make some room here. Let's put the four checkboxes here. So, add existing fields and we got them right there. Click, shift-click, that'll highlight all four of those. Click and drag. Boom, drop them right there. Make a little bit more room down here in the bottom. Slide you guys down and you can make these pretty if you want to. I'm going to format them so they're black. Click, click, click, click. You can put a little space in here: app received, app processed, app approved, app paid out, whatever. So these are all good. Now I'm going to need a way to calculate what percentage is complete based on the values in these four boxes. If it's zero percent complete, if none of these are checked. The first one, 25; the second one, 50; and so on. We're going to do that as a calculated query field. Save this, close it down. We're going to make a customerQ: create, query design, bring in your customer table, bring in the star, bring all the fields in. Now come over here and I'm going to zoom in. Shift+F2. We're going to call this field X, whatever. We're going to add up the values in those four checkboxes. Why? When a checkbox has a value that's no, it's equal to zero. When it's yes, in Access at least, it's negative one. If we add all those up, we'll know that if it's complete, it'll be negative four. If it's half complete, it'll be negative two. So we're going to add these values all up and then divide by negative four. So, it's going to be: app received plus app processed plus app approved plus app paid out. Let's just see what we got here. Adding all four of those together. Run it and let's slide to the end. Check any one of these boxes. Let's see: negative one, negative two, negative three, negative four. Let's check a couple of these. I'll check those two. I'll check these three. At this point, I'm leaving it up to the user to have to do these in order. If you want to force it so that they can't check app processed until app received has been checked before that, that'll require some additional logic, using some events and stuff in there. That'll be a different class. But we just check these boxes like that. Now X doesn't help me. I need a percentage in here. So, let's go back to our query design. Next box over here, again Shift+F2 to zoom in, and we'll call this percent completed. It's going to be X divided by negative four. That'll give me a percentage. The negative four just flips it from negative to positive. Now if I run it, slide to the end, there you go. There's your percent completed. Save this. This will be my customerQ, my customer query. Now, let's go back to the customer form. I can put that percent completed on here. To do that, we're going to have to change where this form gets its data, what table or query it's bound to, its record source. So, I'm going to go up here to the form's properties, and change this from customerT to customerQ. Now we got that calculated field in there. Go to add existing fields, and look at that. Percent completed on the bottom. And so is X, so we don't need X. Click, drag, drop it right there. We'll put it right here. We can see it: percent completed. Slide you over, make your black so you can see it. I put the space in the wrong spot. There. Save it, close it, open it back up. There you go. Maybe format that as a percent. Design View, open up your properties, format, percent. How many decimal places? Let's make it zero. Now, there we go, 25. Now it's time for our images. Now it's time to put our images right here. We're going to put all four of them there. So, go back to PowerPoint or wherever you have your images. Use your screen clip tool, your snip and scatter, whatever. I use HyperSnap. Pick that, try to get this exactly right. Get it right on there. Select it, just like that. It cuts to your clipboard. Come back to Access, paste it in, Ctrl+V. It comes right in here as an image. See that? Yeah, I didn't grab it exactly. I'm going to go get my other ones. Do that four times, five times actually. Get a zero, 25, 50, 75, and 100. Paste them all right, one on top of each other here. I copied my good ones in. Now we're going to name each of them properly. So, here's 100, we're going to call that meter100. Then behind that, I got meter75. Then I got meter50. See how they're stacked on top of each other? Meter25. And then meter00. Give these all good names so we can call them in our code. I'm going to put them back on top of each other. Undo, undo, undo. There we go. Now right now this doesn't do anything. Let me save this, open this up. All you see is that one. Every one's on top. I think I made the other ones invisible, but we don't have to do that at this point. We can do it in the code. If you look on this stuff, nothing happens. So we have to bring this guy to life. So that's where we need our On Current event, which runs when you move from record to record and when you open the form the first time, and we need an After Update event that will fire on each of these checkboxes. That is what makes this guy come to life. So, it's time for some code. Right-click, Design View. Go to the form's properties, go to the Events tab, and let's start with the On Current event. Dot, dot, dot. Code Builder. My application window is very big here, so let's resize that. In the form current event, I'm going to put one thing in here. It's going to say: setMeter, and that's it, we're done. I'm just kidding. setMeter has to do something. It has to know what setMeter is. We can't just say setMeter. We're going to make a Private Sub called setMeter. Basically, this is going to say, hey, go open to this stuff. The first thing I'm going to do is make all of the images invisible. We're going to make all of them invisible, and then just show the one we need. So, we're going to say: meter00.Visible = False. And then do meter25.Visible = False, meter50.Visible = False, meter75.Visible = False, and meter100.Visible = False. Now all of them will be invisible. Let me save this, and we'll show what happens when I open this up now. Open it up, boom, they're all gone. Because the On Current event fired when the first record loaded, and it made all of these guys invisible. Now, after that, we need to show the one that matches the value in percent completed. We'll use an If...Then...Else block for that. If percent completed equals 1 (remember, percentage is a fraction of one, so 100% is equal to 1), then meter100.Visible = True. ElseIf percent completed equals 0.75, then meter75.Visible = True. ElseIf percent completed equals 0.5, then meter50.Visible = True. ElseIf percent completed equals 0.25, then meter25.Visible = True. Else, if it's any other value, meter00.Visible = True. Once again, this only works if you're doing it every 25 like I am. If you're going to have more steps, put more steps, and that's all. Save it. And come back here. Now, if I move from record to record, you should see that event fires. Look at that: 50, 25, 75, 50, and one went to the next guy. 25, there's a zero. See? So that handles moving from record to record, but we still have to handle this. Each one of these checkboxes also needs an After Update event. Fire that event when this guy's updated. Right-click, Design View. Open up this checkbox's properties, find After Update, right there, hit the dot, dot, dot builder button. Now, all we have to put in here is setMeter. That's it. See, that's why I made it its own private Sub up here, because anybody can call it in this form. That's what Private means. Private means anybody in this form can use it. If you want other forms to be able to use it, you have to call it Public. That's a different class. If you're enjoying this and want to learn more about programming, check out my Access Developer Level 1 class. It's all the basics on how to get started programming in Access. Even if you know the basics, I have lots and lots of developer lessons. I think I'm up to around 33 now. So there are dozens and dozens of hours of developer-level training, and more to still come. I make a new one every couple of weeks. So check it out on my website. I'll put a link down below. There's the first one I've received. We have to do the same thing for the other three: setMeter. I'm just going to copy this. Go to the next one, After Update, paste. Do the same for each one. And finally, the last one, After Update, dot, dot, dot, paste. Save it. Close it down. Open it up. It runs when it's updated and every time you click on these guys. Now, what you could do, you could do a Before Update event. If I try to click on one of these guys and the one before it isn't checked already, these have to be done in order. Before Update is a little more complicated. I will cover that in the extended cut for the members. I will also show the members how to do this as part of a running process. If you have a large batch of queries that have to run or file uploads or something, you click a button and as it gets to certain percentages, it automatically updates the arch meter for you. You could do every five if you want to make more images for that. Finally, for the members in the extended cut, I will show you how to make this guy clickable. So it's an actual control: 50, 75. Just click on the bar where you want it to go: 100, 0, 25. Now it becomes more like an actual real control. That is all covered in the extended cut for the members. Silver members and up get access to all of my extended cut videos, not just this one, all of them. There are about 200 of them now. Lots of stuff to watch. Gold members can actually download these databases that I build in the TechHelp videos. So become a member today. How do you become a member? Click on the Join button below the video. After you click the Join button, you'll see a list of all the different membership levels that are available, each with its own special perks. Silver members and up will get access to all of my extended cut TechHelp videos, one free beginner class each month, and more. Gold members get access to download all of the sample databases that I build in my TechHelp videos, plus my code vault, where I keep tons of different functions that I use. You'll also get a higher priority if you decide to submit any TechHelp questions to me, and you'll get one free expert class each month after you've finished the beginner series. Platinum members get all the previous perks, plus even higher priority for TechHelp questions, access to all of my full beginner courses for every subject, and one free developer class each month after you finish the expert classes. These are the full-length courses found on my website, not just for Access, too. I also teach Word, Excel, Visual Basic, and lots more. You can now become a Diamond sponsor and have your name or company name listed on a sponsors page that will be shown in each video as long as you're a sponsor. You'll get a shout out in the video and a link to your website or product in the text below the video and on my website. But don't worry, these free TechHelp videos are going to keep coming. As long as you keep watching them, I'll keep making more, and they'll always be free. IntroIn this video, I will show you how to create a custom pseudo control in Microsoft Access that looks and acts like an arched meter to visually display job completion percentages on a form. We'll talk about using overlapping images built in PowerPoint, setting up the necessary fields in your tables and queries, and writing VBA code to handle the display logic using On Current and After Update events. This approach keeps everything inside Access without requiring special add-on controls, so your custom meter is easy to distribute and works reliably for all users.QuizQ1. What is a "pseudo control" in the context of Microsoft Access as described in the video?A. A control that is built using standard Access objects to mimic a real control's behavior B. A pre-made ActiveX control provided by Microsoft C. A built-in control that comes with Access by default D. A software installed separately from Access Q2. Why does the instructor prefer building pseudo controls instead of using outside controls like ActiveX? A. Pseudo controls are more visually appealing B. Outside controls require extra file distribution and may cause compatibility issues C. Pseudo controls cannot be customized D. Outside controls are easier to use Q3. What tool does the instructor use to create the arched meter images for Access? A. Paint B. PowerPoint C. Microsoft Access itself D. Notepad Q4. If you want to represent a process with four steps (e.g., Application Received, Processed, Approved, Paid Out), how many images did the instructor create for the meter? A. One for each step only B. Five, representing 0, 25, 50, 75, and 100 percent C. Three, representing start, halfway, and complete D. Ten, one for every 10 percent Q5. In the described method, how does Access handle the values of Yes/No (Boolean) fields when adding them to determine completion? A. Yes is 1, No is 0 B. Yes is -1, No is 0 C. Yes is 0, No is -1 D. Both are 1 Q6. How does the calculated query field generate the "percent completed" value? A. By counting Yes fields and dividing by 4 B. By summing the Boolean fields and dividing by -4 to get a fraction between 0 and 1 C. By multiplying the Boolean fields together D. By summing the Boolean fields and multiplying by 100 Q7. After updating the completion steps on the form, which event must be triggered to refresh the visual meter? A. On Click event B. After Update event C. On Open event only D. Before Close event Q8. What does the setMeter subroutine do in the VBA code described? A. It deletes all images except the one needed B. It makes all meter images invisible, then displays the correct image based on completion percentage C. It resizes the images to fit the form D. It adds new checkboxes to the form Q9. Which event ensures that the correct meter image displays when moving between records? A. After Update of the form B. On Current event of the form C. On Load event of Access D. On Error event Q10. How are the images layered and named for use in VBA? A. Placed randomly and named meter1, meter2, etc. B. Stacked on top of each other and named logically, such as meter00, meter25, meter50, meter75, meter100 C. Just one image used and resized D. No naming is necessary Q11. How would you implement forcing application steps to be checked in order (e.g., can't check "Processed" until "Received" is checked)? A. Using After Update event and checking logic in code B. Using only calculated fields C. By changing the tab order of form controls D. By hiding all checkboxes except the next one Q12. What is the main advantage of creating custom meters this way compared to using external controls? A. Requires more manual updates B. No compatibility or distribution issues with external files C. Makes the database much larger D. Less flexible than external controls Answers: 1-A; 2-B; 3-B; 4-B; 5-B; 6-B; 7-B; 8-B; 9-B; 10-B; 11-A; 12-B DISCLAIMER: Quiz questions are AI generated. If you find any that are wrong, don't make sense, or aren't related to the video topic at hand, then please post a comment and let me know. Thanks. SummaryToday's video from Access Learning Zone focuses on how to create a custom pseudo control in Microsoft Access that visually represents job completion with an arched meter, similar to the image submitted by James who wanted to display job completion percentages on a dashboard form.While Access does not come with a built-in arched meter control, it is entirely possible to mimic one by creating what I call a pseudo control. A true custom control would require a significant amount of complex programming and falls well outside the scope of this tutorial. In Access, you do have the ability to add ActiveX controls, such as Microsoft's progress bar, but these require external files and can lead to compatibility and distribution problems, especially if there are version discrepancies across users' systems. My preferred approach is to build pseudo controls using only standard Access objects, so there are no external dependencies and your application remains self-contained. The basic approach to creating an arched meter in Access involves overlaying several images. For a simple scenario, imagine a process with four steps: application received, processed, approved, and paid out. Each step corresponds to a level in your progress meter: 0, 25, 50, 75, and 100 percent. For this, you need five different images. As each step is completed, the visible image updates to reflect the new progress. You can create these images in any graphics software. I used PowerPoint because it's convenient and easy to use. Start by designing your arch using PowerPoint's shape tools, adding multiple layers for different completion levels. You can customize each image with text, shading, or tick marks as desired. The time and detail you put into your images is completely up to you. After creating each image, save or screen capture them individually. I recommend using a tool like HyperSnap or Windows Snip and Sketch for this purpose. Once your images are ready, switch over to your Access database. For this example, I used the free TechHelp template, but you can use any database. The first step in Access is to add four yes/no fields to your table to track which stage each record is at in the process. Set the default value for each of these fields to 'no.' Next, add those fields as checkboxes onto your form. Arrange and format them as you like. To determine the percentage of completion, create a calculated query field. Since unchecked boxes count as zero and checked boxes count as negative one in Access, summing all four and dividing by negative four converts this sum into a positive percentage. Create a query that includes all your table fields plus a calculation that sums these checkboxes. Then add another calculated field that divides this result by negative four to give a value between 0 and 1 (representing 0 to 100 percent complete). Bind your form to this query instead of the table, so PercentCompleted becomes available as a field on the form. Drag the percent completed field onto your form and format it to display as a percent. Now you are ready to add your images. Paste all five images into your form and stack them exactly on top of each other, naming each image appropriately (for example, meter00, meter25, meter50, meter75, meter100). By default, all images will be visible at once, so you'll need to control which image displays based on the current progress. This is where a bit of VBA comes into play. Implement an On Current event for your form (which fires when moving between records or opening the form) and an After Update event for each checkbox. These events should call a private subroutine, setMeter, which hides all images and then shows only the relevant one based on the current percent completed. For example, if the value is 1, only meter100 will be visible; if 0.75, only meter75, and so on. After this setup, your meter will automatically update as you check or uncheck the boxes, both when the record changes and as you interact with the checkboxes. If you want to enforce step-by-step completion (ensuring steps are checked in order), that requires additional logic using Before Update events, which I cover separately for members in the extended cut. For members, the extended cut of this video covers several more advanced variations. I walk you through enforcing sequential order of steps, updating the meter dynamically as part of a progress workflow (such as large batch processes or file uploads), and even making the meter itself clickable so a user can jump to any completion percentage by clicking the bar. You can create finer levels of progress, such as updating every 5 percent, by adding more steps and corresponding images. If you are interested in learning more about programming in Access, I also offer classes such as Access Developer Level 1 covering the fundamentals and many advanced developer lessons. Finally, please remember that you can find the complete video tutorial with step-by-step instructions for everything discussed here on my website at the link below. Live long and prosper, my friends. Topic ListBuilding a custom arched meter pseudo control in AccessCreating step images for the arched meter in PowerPoint Saving and importing images into Access forms Setting up process step fields in an Access table Adding checkboxes for process steps on a form Calculating progress percentage using a query Binding a form to a query for calculated fields Displaying calculated percentages on a form Overlaying images to simulate a meter control Naming and organizing images for code access Writing VBA to control image visibility Using the On Current event to update the meter Using the After Update event to refresh the meter Creating a shared Private Sub for updating control state Making the arched meter respond to user interaction Handling multi-step processes with variable images Primary TopicsMicrosoft Access forms, custom pseudo controls, progress indicators, arched meter visualization, overlapping images, VBA event handling, calculated fields, query design, form design.Secondary Topicsuser interface design in Access, image creation for UI, query-based calculations, event-driven programming. |
||||||||||||||||||||
|
| |||
| Keywords: TechHelp Access How to create a control in access, customcontrol, arch meter, arched meter, custom control PermaLink Pseudo Control in Microsoft Access |