Age Demographics
By Richard Rost

 4 years ago
Bracketed Age Demographic Groups in Access
In this Microsoft Access video tutorial, I'm going to teach you how to calculate the ages of your customers, and then display them in bracketed demographic age groups, such as "under 18," "19 to 25," "26 to 45," "46 and older," etc.
Philip from Des Moines, Iowa (a Gold Member) asks: I do a lot of work with age demographics. Right now, I copy all of my customer data over to Excel to do my reporting. I need to know, for example, how many customers are in their 30s, 40s, 50s, etc. Can this be done in Access alone?
Members
Members will learn how to make the demographic brackets user-editable, so you don't need to make design-time changes to your query. We'll also have some fun with pie charts!
Silver Members and up get access to view Extended Cut videos, when available. Gold Members can download the files from class plus get access to the Code Vault. If you're not a member, Join Today!
Update!
- I will show you another method to create the age demographic group brackets using the Switch function in tomorrow's Fast Tips video here: https://599cd.com/AgeDemographics2
Pre-Requisites
Links
Recommended Course
 Keywords Keywords
access 2016, access 2019, access 2021, access 365, microsoft access, ms access, ms access tutorial, #msaccess, #microsoftaccess, #help, #howto, #tutorial, #learn, #lesson, #training, #database, Age Group Range Statistic, age demographics, demographic reports, age groups, age brackets, Group age data into age ranges, how to I make a query for age groups, Age Group, grouping
More InformationTranscript Welcome to another TechHelp video brought to you by AccessLearningZone.com. I am your instructor, Richard Rost. In today's video, we're going to talk about age demographics, getting a count of customers by age demographic groups in Microsoft Access.
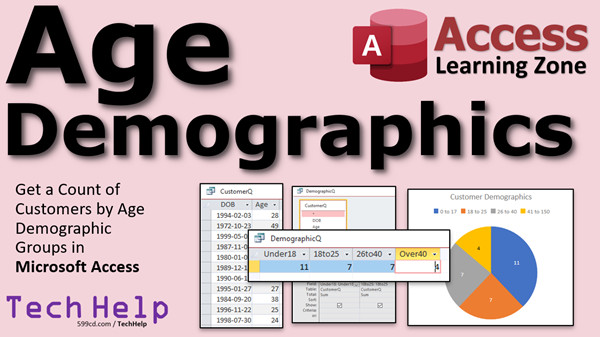
We have under 18, 18 to 25, 26 to 40, and so on. We'll figure out their age first, based on their date of birth, and then we'll put them in groups like that.
Today's question comes from Philip in Des Moines, Iowa, one of my favorite cities to pronounce, Des Moines, one of my gold members. Philip says, I do a lot of work with age demographics. Right now, I copy all my customer data over to Excel to do my reporting. Say it isn't so. I need to know, for example, how many customers are in their 30s, 40s, 50s, etc. Can this be done in Access alone?
Yes, of course, Philip, it can. Whenever I hear someone say they're taking their data out of Access and moving it over to Excel, that's just a matter of not knowing how to do it right in Access, which is what I'm here to show you. There are very few things outside of the crazy Excel financial formulas and stuff like that, that Access can't do by itself. And with a little tweaking, you can even do some of the cool Excel stuff straight in Access too. But that's a whole different video. Today, let me show you how to do this.
Before we get started, I have a couple of prerequisite videos for you. If you don't know how to calculate someone's age based on their date of birth, go watch this video. We're going to use my simple age calculation. It's 99.9% accurate, and it's good enough for doing simple demographics like this.
If you don't know how to do an aggregate query, go watch this one. That's how you can group records together based on, for example, someone's age. And one more thing, you'll need to know the IIF function. It's basically an IF-THEN wrapped inside one function. If you don't know how to use this, go watch this video. These are all free videos. They're on my website and my YouTube channel. I'll put links you can click on down below in the description under the video. Go watch these three things and then come on back.
Here I am in my TechHelp free template. This is a free database you can grab a copy of off my website and learn how it's built. All the videos are online. Today is one of those videos where it's basically going to be taking things I've already showed you in other TechHelp videos and putting them together in a different way. Nothing today is really new. It's just assembled differently.
It's kind of like I always say: using Access, or building software in general, but especially Access, is like playing with Legos. I can teach you how the different pieces snap together, but the toy that you build is completely on your own. You can do whatever you want. I'm going to show you the stuff that we've done in previous videos, especially if you've taken my full lessons, you'll see a lot of this stuff is familiar. But I'm going to snap the Legos together a little bit differently. You're going to go, oh, that's how you can do that.
First thing we have to do is figure out some ages. Take a look at your customer table. We have a field here called CustomerSince. That's how long they've been a customer. We're going to pretend that's their date of birth because I don't feel like changing things. So we're just going to use CustomerSince as their date of birth. Let's make a query and calculate their age. We know how to do this from my age video.
Go to Create and then Query Design. Bring in that customer table. You can close that pane. From here, bring in the CustomerSince field because we really don't care about anything except the age of the customer. I don't care about their name, their ID, their address or any of that stuff. All I want is just a count of how many customers fall into which age brackets.
Since we're calling this CustomerSince field their date of birth, I'm going to alias that. Basically, I'll zoom in for you, Shift F2, which means in front of that, I'm going to put in DOB and then a colon. We're going to pretend that's a field called Date of Birth. That's how you rename a field in a query. It's called an alias. If I run this now, it comes out as DOB. I can use DOB in my calculations, which is also shorter than CustomerSince. I don't want to type that everywhere.
Now I'm going to make a calculated field over here, which we know how to do from the age video. I'll just paste in the formula. There it is. It's straight from the other video. I'll zoom in. Age is going to be that. It's the Int of today's date minus their date of birth divided by 365. 365 days in a year, 0.2425 if you want to be exact. As I mentioned in the last video, this is over 99.9% accurate and it's certainly good enough for a simple demographic thing like this.
Now if we run the query, we've got everyone's age right there. These are CustomerSince dates and the company's not that old, so you're going to find most of these values in here are like 29, 16, 18. Let's make some people older in here. I'm feeling kind of old myself. My 50th birthday is later this year. Actually, in like two weeks. I was born in 1972; not 50 yet. That's not my birthday, but I'll put my birthday in. Let's put in a couple of 1984, 1985, 1986. We'll just mix this up a little bit. 1962. We have a couple older people in here. I don't feel so bad now.
Let's save this as MyCustomerQ, MyCustomerQuery. Now if we made an aggregate query out of this, we could get a count of how many people are specifically a certain age. If I sort this list, you could see, for example, I have four people who are six years old. You could do that with a simple aggregate query.
Come in here and go to Create, Query Design. Bring in that customer Q. Bring in the age field. If you run that, you get a list of ages. Now, make this a total query or an aggregate query. With the Group By, that's going to group everybody together. You can see there's only one record for six because that's the group. If you also want to see how many records there are that are six, you add Age in again a second time. This time, change the Group By to Count. Run it now. There were four people who are six years old, four people who are 19, and one person who is 49. I'm sitting right here right now.
But I don't want just each age here as a separate group. I want a bracket of ages. I want like 25 to 36 all grouped together. Let's forget about this for just a minute. Close this. Don't save that. We don't need that right now.
Let's go back to our customer Q. I'm going to say up front, there are a million different ways to do this. Whenever I make a TechHelp video, I always do a quick Google search myself and see what other people have to say about the topic. I always come across a million different methods. I've seen some using a SWITCH statement. I've seen some people make an AgeGroup function. I've seen all kinds of different methods.
I've tried to pick the method that I like and that I've used in the past, which I have. As an instructor, I try to teach the method that I think is the easiest to understand. There might be some better ways to do this, but this is the way I like, so this is what I want to teach you.
What I'm going to do is put little groupings right here in the query. In this first group, I'm going to say, okay, using my IIF function, I'm going to say if the person's age is under 18, then put them in a group here called Under 18. I'll zoom in. I'm going to make the field called Under 18: IIF(age < 18, 1, 0). Basically a true/false, but I'm going to use ones and zeros because later on, we can add up all the ones here. Trust the value of a negative one, then you have to multiply by negative one. Just do what I have there. You'll see what I'm doing in a minute.
Ready? Save it, and then run it. Everybody who's under 18 has a one in that category. See that? Like that.
Let's do it again for the other groups. Philip, I know you are only doing like 20s, 30s, 40s, so I have an even easier solution for you. I'll talk about it in just a few minutes. But for me, most of the time I see age demographics, it's never an even decade.
Let's make the next group. Click over here. We want to do 18 to 25. Normally, I try not to make field names, especially in tables, start with anything other than a letter. Numbers are allowed, but I frown on them, although I sometimes make exceptions. This is one of those exceptions. I'm going to make a group here called 18 to 25. What's it going to be? It's going to be IIF(age >= 18 AND age <= 25, 1, 0). Put a 1 in there. Now I'm going to copy this because we're going to use it a couple more times. Ctrl+C, copy that.
Run that now. There's your 18 to 25-year-olds. 19, 23. There's a 0 here and a 1 there. See where I'm going with this?
We'll do two more groups right here. Paste it in. We'll do 26 to 40. So this will be 26 to 40. Make sure you don't overlap. 26 to 40. That's on you as the designer. That's a PebKac error. We'll do one more, which is over 40. It's going to be Over 40: IIF(age > 40, 1, 0). That should cover everybody.
Save it. Run it. There are all your demographic groups broken down. Everybody should have at least one and only one.
We're done with the customer query. Save that. Close it down.
Now, let's go make our demographic query. Go to Create, Query Design, and bring in the customer query. Now we just need our demographic group fields. Bring in those fields. You can select them all and drag them all at the same time. I'm lazy. If I was really lazy, I'd do this and then bring them all together, and that would save me some clicks.
If I run this now, you get that. Now it's time to make our aggregate query. I'm going to group these all together. Turn on the Totals.
For Group By, don't use Count, because if you use Count, watch what happens. If you run it, you get all 29s. Why? Take a look at the data. There are 29 records. 0 is a value, so if you count all the records, 1s and 0s will both show up in your count. So what you need to do is use Sum on these records. Sum them up. It'll add up all the ones in that field, the calculated query field, that are 1s, and the 0s just add up to nothing. There you go. 11, 10, 6, and 2 over 40s. This is like shopping at one of those under 21 type stores, I guess.
I personally hate when aggregate queries use Sum Of in the field name. I don't like that. What I end up doing is coming in here and aliasing these guys to keep their original names. It's a little weird. I go Under 18: [Under 18], and copy that for each column. And now it'll replace "Sum of Over 40" with just "Over 40". There's your field names. Now I can save this as my demographic query, or whatever you want to call it.
Yeah, there are a million other methods to do this. I think this is nice and easy. It's pretty straightforward. If you look at this, you can see exactly what I did. Just follow back to the customer query, open it up, and you can see it's easy to understand with all these IIFs. There's no real complicated SQL. Although if you do look at this in SQL, it is kind of convoluted, but it's easier to understand if you look at it in the designer. There is a thing called a SWITCH statement you can use and all that. I think this is the easiest way myself.
Now, Philip, if you're just breaking these down into what decade they're in and that's all, most demographic reports I see are always like, 18 to 25, 26 to 34, it's never an exact decade. But if that's all you need, just yesterday I posted a video, a Fast Tips video on how to do decades. You take a date and you pull out the decade. It's real simple and you can use it for this method too.
For example, you can say Decade: take their age, integer divide by 10. So if you're 23, you'll just get 20. Or technically, you'll get a 2, and then you multiply that by 10. Same thing I did in the decade video yesterday. Boom. It takes 23, integer divide by 10 is 2, multiply by 10, you get 20. There's a 20-year-old. There's someone in their 30s. There's someone in their 50s. If you only want the decade, there you go. Of course, these guys haven't reached their first decade yet. They're babies.
This method is easy to use. We set it up relatively quickly. You can make changes to this by just coming into the query. But the problem with this method is you do have to come in here and make changes to the query design if you want to change these brackets. If that's something that happens a lot, you might want to make it so the user can change those brackets - the maximum and minimum values of each bracket - without having to go into design of the database, because we always want to keep our users out of database design. We can lock the front end.
If that's the case, I'll show you how to do that in the extended cut for the members. We'll set up a table where each of the groups has a minimum and maximum value, right? So 0 to 17. Then we'll do the count, similarly to what we did in this query. A little bit different because we have to look at two different fields here. Then we'll do some fun with pie charts. We haven't done a lot with charts. I'll show you a modern chart and I'll show you the classic old school chart. I actually like the classic old school charts better. The modern charts still have a lot left to be worked on. They look cleaner, crisper, but functionally, these old guys are better. I'll show you all of this stuff in the extended cut for the members.
Members will be able to come in here and just change these on the fly if you want to, or your user can. I'm going to make a query, but you can make a pretty form if you want to make a form for your users to come in and say, "OK, I want 18 to 23, and I want 24 to 46, and then I want 47 to 105," whatever. Figure out who your oldest customer is and put that in there. This is something that the user can do. You don't have to do this in a query anymore. This again will be covered in the extended cut for the members.
As a reminder, Silver members and up get access to all of my extended cut videos, and there are lots of them, like 300 of them. Join now, click that blue Join button, and get in the party. Jump in the pool; everyone's doing it. All the cool kids are doing it. We're going to streak in the quad later too.
I hope you guys learned something and I'll see you next time. Intro In this video, we'll talk about how to generate age demographics reports in Microsoft Access by calculating customer ages from a date of birth (using the CustomerSince field for demonstration), grouping those ages into custom brackets like "Under 18," "18 to 25," and so on, and using aggregate queries with the IIF function to count the number of customers in each group. We'll also cover tips for working with age brackets and mention a quick way to group by decade. Quiz Q1. What is the primary goal of the video?
A. To teach how to export customer data from Access to Excel
B. To show how to count customers by age demographic groups within Access
C. To design age demographic reports in Excel
D. To explain the history of Microsoft Access
Q2. What field is used in the example as a stand-in for the "date of birth"?
A. DateJoined
B. CustomerName
C. CustomerSince
D. AgeBracket
Q3. What formula is used to calculate a customer's age from their date of birth?
A. Year(Now()) - Year([DOB])
B. Int((Date() - [DOB]) / 365.2425)
C. Month(Now()) - Month([DOB])
D. Day(Now()) - Day([DOB])
Q4. What function is recommended for creating age group columns in the query?
A. SUM
B. SWITCH
C. IIF
D. LEFT
Q5. How does the IIF function help in grouping customers into age brackets?
A. It counts only those with missing age values
B. It creates Boolean (1 or 0) columns for each group based on age criteria
C. It concatenates group names
D. It sorts ages in ascending order
Q6. What aggregate function should be used to total the number of people in each age group column?
A. Average
B. Min
C. Max
D. Sum
Q7. Why should "Sum" be used instead of "Count" for the aggregate query in this scenario?
A. "Count" ignores zeros and only processes non-numeric data
B. "Sum" adds up only ones, ignoring zeros, thus accurately counting group members
C. "Count" is not available in Access queries
D. "Sum" is faster to execute
Q8. What is an alias in the context of Access queries?
A. A backup copy of a query
B. A temporary database user
C. A way to rename a field within a query for easier use
D. A type of macro
Q9. What is a potential downside of hardcoding age brackets into a query as shown in the example?
A. Access will not allow more than three brackets
B. Users cannot change brackets without entering query design mode
C. The database becomes slower
D. Bracket counts might include duplicates
Q10. What is suggested as an alternative for groups based purely on age decades?
A. Use the SWITCH statement for greater clarity
B. Integer divide age by 10 and multiply by 10 to get the decade
C. Only use Excel for decade calculations
D. Use Count instead of Sum in aggregate queries
Q11. If users want to be able to change the demographic brackets themselves, what design improvement is recommended?
A. Lock the database
B. Store the min and max values of each bracket in a separate table
C. Use Excel pivot tables instead
D. Remove all queries from the database
Q12. What benefit does the instructor highlight about using Access for demographic grouping vs. Excel?
A. Access cannot perform aggregate queries
B. Excel generates better-looking charts
C. Access can handle complex demographic grouping internally and efficiently
D. Excel is more secure than Access
Answers: 1-B; 2-C; 3-B; 4-C; 5-B; 6-D; 7-B; 8-C; 9-B; 10-B; 11-B; 12-C
DISCLAIMER: Quiz questions are AI generated. If you find any that are wrong, don't make sense, or aren't related to the video topic at hand, then please post a comment and let me know. Thanks. Summary Today's video from Access Learning Zone covers how to calculate age demographics and group customer counts by age brackets using Microsoft Access.
In this lesson, I'm going to show you how to track how many customers fall into various age groups such as under 18, 18 to 25, 26 to 40, and so on. We'll start by calculating the ages from each customer's date of birth, then we'll organize them into the appropriate categories.
The topic today comes from a question by Philip, who works with age demographics and typically exports his data to Excel for reporting. He wanted to know if it was possible to handle these groupings directly in Access, such as finding out how many customers are in their 30s, 40s, or 50s. Absolutely, you can accomplish this in Access without needing to move your data to Excel. Most basic analysis and reporting can be handled right in Access, including some calculations that people traditionally associate with Excel.
Before getting into the solution, there are a few foundational skills you'll need. First, you should know how to calculate a person's age based on their date of birth. There is a free video available that demonstrates this using a simple formula, which is accurate enough for demographic grouping. Next, you should be familiar with creating aggregate queries, which allow you to group and summarize records. Lastly, you should understand how to use the IIF function, which works like an IF-THEN statement to return a value based on a condition. If any of these concepts are new to you, I recommend reviewing those videos first; they're available for free on my website and YouTube channel.
For this demonstration, I'm working with the TechHelp free template database, which you can also download and use to follow along. The techniques I'm showing today draw on skills from earlier videos, but here I'm combining them in a new way. Working with Access is like building with Legos: once you understand the individual pieces, you can assemble them in many different ways to solve new problems.
Let's begin by calculating the ages. In the customer table, there's a field called CustomerSince, which marks how long someone has been a customer. For this example, we'll treat this as if it were their date of birth, just to avoid altering the data structure. We'll create a query, bring in the CustomerSince field, and give it an alias of DOB for convenience. After that, we'll insert a calculated field for age using the standard formula based on the current date and the DOB. This formula is accurate for simple age calculation and appropriate for our classifications here.
Once the query is run, you'll see the ages appear. If you want to add a broader range of ages or simulate a more varied database, you can manually add more birthdates. After this, save the query, for example as MyCustomerQ.
Suppose you want to see the count of customers at each specific age. You can use an aggregate query on the ages to get that breakdown. However, our goal is to group ages into ranges. For this, let's move on from individual ages and focus on demographic lanes.
There are many approaches to grouping ages, such as using a SWITCH statement or writing a custom function to assign age groups. However, I like to keep things simple and approachable, so I'll demonstrate a straightforward method using the IIF function.
Within your query, you can define new fields for each age group. For instance, the field Under 18 uses IIF to return 1 if the age is below 18 and 0 otherwise. Repeat this approach to add fields for 18 to 25, 26 to 40, and over 40, adjusting the conditions appropriately. The resulting dataset will flag each customer with a '1' in the column matching their age group.
After finalizing these groupings, move to creating a new query for demographic reporting. Bring in your demographic fields from the previous query and build an aggregate query. Here, instead of using Count (which tallies all records, including zeros), you want to use the Sum function for each group. This way, you only add up the '1's, giving you an accurate count per group. If you prefer cleaner field names, you can use aliases to revert aggregate field names like 'Sum of Under 18' back to 'Under 18'.
There are certainly other methods for grouping, but I find this to be direct and easy to follow. If all you want are decade-groupings, for example, people in their 20s or 30s, I've covered that in a recent Fast Tips video. The idea is to divide their age by 10, discard the remainder, then multiply by 10, effectively grouping ages by decade.
The method shown here is easy to change if you want to adjust the age brackets, but you would need to open the query in design view to do so. If your users need to adjust the brackets themselves, you can create a table to define group minimum and maximum ages, allowing more flexibility without entering the database design. In the Extended Cut for members, I'll demonstrate how to create such a system, including how to use charts for visual demographic representation, both modern and classic styles.
Members will see how to let users update group brackets on the fly through queries or a form, which is much safer and more user-friendly than editing queries. All of this is detailed step-by-step in the members-only extended content.
If you found this helpful and want to learn more, you can find a complete video tutorial with step-by-step instructions on everything discussed here on my website at the link below. Live long and prosper, my friends. Topic List Calculating age from date of birth in a query
Aliasing fields in a query using colon
Creating calculated fields for age demographic groups
Using the IIF function to group ages into brackets
Building aggregate queries to count customers in each group
Summing values in aggregate queries to get group totals
Renaming fields in aggregate queries to remove "Sum Of"
Demographic grouping by decade using integer division
Adjusting query design to change age group brackets Primary Topics age calculation, age brackets, aggregate queries, IIF function, query design, data grouping, demographic reporting
Secondary Topics query aliasing, SWITCH statement alternative, decade grouping, user-editable brackets
|