Colored Data Bars
By Richard Rost

 2 years ago
Combine Data Bars with Color Scales in MS Access
In today's Microsoft Access tutorial, I'm going to teach you how to create Colored Data Bars, which are a mix between regular data bars and color scales that you can build in Microsoft Excel with conditional formatting. We're going to learn how to do that today in Access, which isn't something you can easily do in Excel.
Members
Members will learn how to enhance their color data bars so that they can work with any scale of values instead of just one to 100.
Silver Members and up get access to view Extended Cut videos, when available. Gold Members can download the files from class plus get access to the Code Vault. If you're not a member, Join Today!
Prerequisites
Links
Colored Data Bars Series
Keywords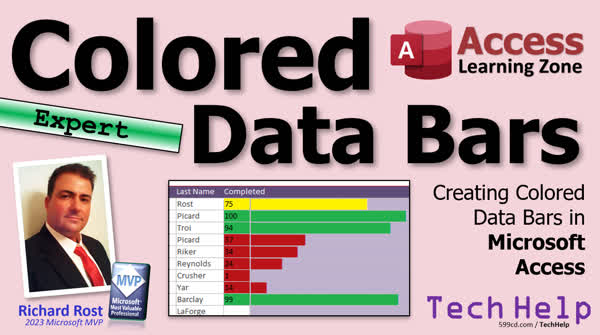
TechHelp Access, create colored data bars, conditional formatting access, access data visualization, color scales Access, Excel-like formatting Access, custom data bars Access, Access tutorial, visual data representation, Access conditional formatting, Access database design, advanced Access features, Access design tips, Access form design, graphical data Access, Access form customization, enhance Access forms
Transcript In today's video, we're going to sum up what we learned in the last two videos.
We learned about data bars, which are these funny things that go across like that. The bigger the number, the bigger the bar. We learned about color scales. Larger values are green, mid-range values are yellow, and low-range values are red.
We're going to put these two things together, and we're going to make colored data bars. The color will change as well as the length of the data bar. It's going to be super cool, and you can't easily do this in Excel, so ha ha. There's one thing that Access can do better and easier than Excel can.
If you haven't watched those other two videos yet, go watch those first. I'll put links to both of those down below. Go watch those and then come on back.
A couple of years back, I did a video four years ago. It didn't seem like that long. I did a video on progress bars. I showed how to make progress bars, and in this video, I showed you three different techniques.
I showed you how to use the progress bar control. That's an ActiveX control that comes with Access. I don't personally like ActiveX controls, but this one is not too bad. The problem with ActiveX controls is distributing them. If you have a database you're giving to other users, you have to make sure everyone's got the same control. It's got to be installed in the same place, and everyone's got the same versions. It's just a pain. So I like doing as much as I possibly can inside Access with Access native controls.
I showed you two other methods. This method here I showed you by just putting together a string of x's with a percentage after it. And then in the extended cut, I showed you this cool 3D bar where we actually use a rectangle. We can change the width of the rectangles. You can't do this with a continuous form because once you change the properties of an object on a continuous form, you change all of them. So if you change the rectangle's width, you change all of the rectangles.
What we're going to do today is going to be a little closer to this one down here, by putting in a string of characters. I'll explain as we do it.
Here I am back in yesterday's database. I'm going to come in here, and we're going to get rid of this stuff. This is very easy to do, once again, if you've got a static set of data. So if you're going from 1 to 100, for example. To do it with a variable range of data is going to be a lot more complicated, and I am going to cover that in the extended cut for the members. But for now, we're just going to do it from 1 to 100.
Even when I do it in the extended cut, we're not going to use these form fields here. We're going to do something a lot more complex, so let's get rid of that stuff there.
Let's go back into the conditional formatting and set this back to where it was before. So if it's greater than, let's say, 67. This one here is going to be greater than 33, and this one here will be greater than or equal to 0 or 1 or whatever you want it to be, just to keep it simple. Take a peek to make sure it's still working. Okay, good. We'll put you back to 100.
Now our data bar is going to be done in a query. So let's go over here and we're going to make a query - Create Query Design. Let's bring in our customer table. I just want the fields that are going to be in the form: customer ID, first name, last name, and completed. That's all I care about.
Now in the query, we're going to build a bar that's going to use the block character, the ASCII character. All the characters on the keyboard and some have an ASCII code associated with them. Capital A is 65, period is 46, and so on. We're going to look for the 219 character, the solid block. We'll put a bunch of those together, and it looks like a bar. I can put them together with something called the String function.
Let's say that S is going to be, we just make up some new field called S, and I'll zoom in for it. S is going to be a string of characters. How many? Let's say Completed. How many are completed? So 100 across, 10 across, whatever. What are we going to put in there? We're going to put that character, but we're not going to put an X. We're going to put ASCII 219.
How do you do that? So, the Alt key on your keyboard, ALT, and on your numeric keypad, type in 219 and then let go of the Alt key and you get that thing. Hold down the Alt key, press 219 on the numeric keypad and then let them go. That guy should pop in there. Then you can get rid of the X.
That is the ASCII extended character code for a solid block.
Save it. Let's call this the CustomerList, customer_list_q. Let's take a peek at it. Let's run the query and there we go. There's a big long list of them. That's a lot of blocks. Let's see that. That one goes out to 50. Let's cut this down a little bit. Let's divide this result here by 10. So let's say every 10 blocks. In fact, let's make a smaller value here. Let's say C.
Let's say C is going to be Completed divided by 10, and let's get the Int of that. So if it's 99, it'll be 99 divided by 10 which would be 9.9, and then Int of that, it'll just give you 9. The value you see is our value. We're just basically making it smaller.
Let's put this over here, and then instead of Completed, we'll just make C in it. Now let's run it. Oh, I spelled it wrong, it was Completed. If you see "Enter Parameter Value" and you're not expecting to, you spelled something wrong. It happens all the time. Completed. There we go. That looks much better.
Let's go a little bit bigger. Let's divide it by five instead of ten to make the bars a little bit bigger. Okay, perfect. There we go.
We don't want to see errors down here, so we can use Nz with Null to zero to get rid of those. Let's do that in here. Let's Nz Completed, so if Completed is Null, this will take it and make it a zero. That's what the Nz function does. I have a video on that too if you don't know what that one is. There we go. Perfect.
Now we've got our Completed value that's already in the form, now we just have to add this guy to the form.
Let's come back out here. Save changes. Yes. Now let's just add a list. Design this. Let's make this bigger now.
We're going to add in that field. So, Form Design, Add Existing Fields. We have to change our record source first, don't forget that. Change our record source: Data, we're now working with customer_list_q. Now it should show up on my Add Existing Field, and there it is. C and S. We just need S.
Make this big enough so it fits, so probably about, I'm guessing, big. I'm just going to select everybody, right click, size to grid to make sure one fits. Save it, close it, open it.
We're getting somewhere. There's your bar. There's your color scale. Now we just have to apply these colors using conditional formatting to this thing. We can't use "the field value is"; we have to use an expression because it's a different field.
I have a whole separate video on this one. This is using conditional formatting but basing it on a different field.
Design view. Let's take a look at this guy one more time. The value of Completed is 67 or higher, or higher than 67, higher than 33, or greater than or equal to zero.
Now we're going to do the same thing with this, but we want to change the foreground color, the color of the bar itself.
Conditional formatting. New rule, Expression is: Completed is greater than 67. Make the foreground color green, and hopefully you get the same color green you had before.
New rule, Expression is: Completed is greater than 33. This was yellow.
Finally, new rule, Expression is: Completed is greater than or equal to zero. This was red.
Oh, wrong one. I just caught myself. This guy - red. This one: back to automatic. Apply. Save it. Bring this up here. Close it. Open it. Boom.
We got a little teeny tiny red there. Let's make this a 45. Let's make it 32. There we go.
What happened there is I tapped into it. We want to make it so you don't tab into this, first of all. Right-click, Design View. Let's open this guy up. Let's lock it so the user can't change the value there.
While I'm in here, let's get rid of the padding. Where's padding? Here's padding down here. So there's no room around it. Let's set these all to zero. That's the room around the data inside the field. Let's make it so this is not a tab stop. So I was in the right spot in the first place. Double-click, Other, tab stop is No.
Now that's looking better. Let's change you to a 42. That looks good. How about a 25. Oh yeah.
If you don't want to see the white background, just go in here and take this and on Format, do the shape fill as transparent. It will look like that. When the data bar comes in, that's what you see. You can even turn these outlines off. I kind of like the outlines though. You can play with this and get the borders just right and make it look perfect, but that's good enough for now.
That looks pretty cool.
Again, this works if you're going from 1 to 100. But what if your scale isn't 1 to 100? It's a lot more complicated. We have to do some changes in the query and some extra calculations and all that cool stuff. We're going to do it in the extended cut for the members.
Silver members and up get access to all of my extended cut videos. There are lots and lots of them. There are hundreds of them. It's well worth it. For $5.99 a month, you can get it and watch tons of stuff.
There you go, there is your TechHelp video for today. I hope you enjoyed this little mini-series that I did with data bars, color scales, and colored data bars. I hope you learned something.
Live long and prosper, my friends. I'll see you next time.Intro In this video, we will talk about how to create colored data bars in Microsoft Access by combining a data bar with a color scale, so that both the length and color of the bar visually represent your numeric data. We'll review using ASCII characters to build the bars in a query, set up conditional formatting to apply different colors based on value ranges, and show the process step by step in a form. This approach is easier and more flexible in Access compared to Excel.Quiz Q1. What is the primary advantage of creating colored data bars in Access instead of Excel, as mentioned in the video?
A. Access makes it easier to create colored data bars than Excel
B. Excel is not compatible with data bars at all
C. Access does not require formulas for conditional formatting
D. Excel cannot handle numeric data
Q2. What do data bars visually represent in a form or report?
A. The date range of records
B. The magnitude of a numeric value by the length of a bar
C. The number of fields in a table
D. The alphabetical order of data
Q3. How do color scales function according to the tutorial?
A. Green for the lowest, yellow mid-range, red for highest values
B. Randomly assigned colors for all values
C. Green for the largest, yellow for mid-range, red for low values
D. Yellow for the highest, green for mid-range, red for lowest
Q4. What is the main problem with using ActiveX progress bar controls in Access databases for other users?
A. They cannot display bars in Access
B. Distribution and compatibility on different systems is difficult
C. They only work on Excel, not Access
D. They cannot be used in queries
Q5. What ASCII code is used in this video to represent a solid block for the data bar?
A. 120
B. 145
C. 219
D. 196
Q6. Which function in Access is used to repeat a character a specific number of times to build the data bar?
A. REPLICATE()
B. RepeatString()
C. String()
D. RepeatChar()
Q7. Why is the Int() function used when dividing completed values before generating the data bar?
A. To increase the value
B. To convert the number to a decimal
C. To ensure the length of the bar is an integer and not a decimal
D. To apply conditional formatting
Q8. What does using the Nz function help prevent in the query?
A. Errors caused by null values
B. Inaccurate colors on data bars
C. The form from closing
D. New rows from being added
Q9. Why must the form's record source be changed to customer_list_q?
A. To access the new calculated data bar field in the form
B. To remove all customers from the list
C. To allow editing of the data bar directly
D. To apply automatic formatting
Q10. When applying conditional formatting to color the data bar, which property needs to be changed for the bar?
A. Border color
B. Foreground color
C. Font size
D. Shape outline
Q11. To prevent the user from editing or tabbing into the data bar, what should you do?
A. Set the field's tab stop to No and lock the field
B. Change the font to bold
C. Hide the field
D. Add data validation rules
Q12. What is the main challenge when applying this colored data bar technique to a data range that is not 1 to 100?
A. The colors will not display
B. Requires more complicated calculations in the query
C. Access crashes
D. Conditional formatting is impossible
Q13. If you see an unexpected "Enter Parameter Value" prompt when running your query, what is the most likely cause?
A. Wrong table selected
B. Misspelled field name
C. Too many records in the query
D. Incorrect data source selected
Answers: 1-A; 2-B; 3-C; 4-B; 5-C; 6-C; 7-C; 8-A; 9-A; 10-B; 11-A; 12-B; 13-B
DISCLAIMER: Quiz questions are AI generated. If you find any that are wrong, don't make sense, or aren't related to the video topic at hand, then please post a comment and let me know. Thanks.Summary Today's TechHelp tutorial from Access Learning Zone will review and combine what we have learned about data bars and color scales in Access forms. Over the past two lessons, I have explained how to use data bars, which visually represent values by stretching across the field according to the number's size. The higher the number, the longer the bar. I also went over color scales, where larger values show up in green, mid-range numbers in yellow, and low-end values in red.
Today I'll merge these two features to create colored data bars, so not only will the bar's length reflect your data, but its color will also change based on the value. This is something that is surprisingly easier to achieve in Access than in Excel.
If you have not watched the previous videos on data bars and color scales, I recommend checking those out first to understand the foundational concepts. You can find links below.
A few years back, I created a video about progress bars in Access. In that lesson, I demonstrated three methods. First, I used the progress bar ActiveX control included with Access. While this option works, ActiveX controls can be problematic because if you distribute your database, the recipient needs to have the same controls installed in the same location and version. It can be a hassle, so I prefer to stick with features built straight into Access whenever possible.
Aside from the ActiveX approach, I also showed two other methods for progress bars. One involves assembling a string of characters, like a series of X's, to represent progress, along with a percentage. In the extended cut of that particular video, I took it a step further and demonstrated a 3D progress bar using rectangles, changing the width based on data. This only works reliably in single forms, since continuous forms would alter all the rectangles at the same time if you try to dynamically resize them.
What we'll be doing today is most similar to the string-of-characters approach. Instead of letters, we will use block characters, which have an ASCII code, to build a visual bar in a text box.
Starting with our database from the previous lesson, we will first clean up any unnecessary items. This technique is straightforward as long as you have a fixed scale, such as values from 1 to 100. Dealing with variable ranges gets trickier and I'll cover that more advanced scenario in the extended cut for members.
For now, we'll stick with the 1 to 100 scale. I'll reset the conditional formatting rules back to their original state to keep things clear. For example, we'll set one condition for values above 67, another for above 33, and the third for values greater than or equal to 0.
Next, our data bar will be generated in a query. In Query Design, I will include just the necessary fields from the customer table: customer ID, first name, last name, and completed. The bar will be created by repeating the block character, which is ASCII character 219, based on the number completed. This character is not typically found on your keyboard, so to insert it, you hold down the Alt key and type 219 on your numeric keypad.
We will use the String function in the query to automatically create a number of blocks equal to the completed value. For example, if completed is 50, you see 50 blocks. To avoid the bar getting too long, we'll reduce the number by dividing completed by 10 or 5 and rounding down with the Int function. That way, the length stays manageable.
If you encounter an "Enter Parameter Value" prompt, it usually means you mistyped a field name in the query, so double-check for spelling errors. To avoid errors from empty values, you can wrap the field with the Nz function, which turns Nulls into zeros. I have an entire video covering the Nz function if you are not familiar with it.
Once the query is set up, save it, and then update your form to use this query as its record source. Add the field containing the bar (let's call it S) to the form, adjusting its size so the bar displays correctly.
Now, to color the bars, we apply conditional formatting based on the completed value, not the bar itself. Since the data bar is based on a different field, we use expressions in the conditional formatting rules. Set up rules so that completed values over 67 are green, over 33 are yellow, and zero or higher are red.
Sometimes, you may want to tweak the appearance by making the field read-only (locking it and removing it from the tab order), removing extra padding, or setting the background to transparent for better aesthetics. You can also adjust the bar length by changing the formula in the query to divide by different numbers.
What I have shown here works well when your data is always on a 1 to 100 scale. If your data span is not consistent, more sophisticated query logic and calculations are necessary. I will cover those more advanced techniques in the extended cut available to members.
Silver members and up have access to all my extended cut videos, which cover hundreds of additional advanced topics for a small monthly fee.
You can find a complete video tutorial with step-by-step instructions on everything discussed here on my website at the link below.
Live long and prosper, my friends.Topic List Review of data bars and color scales in Access
Combining data bars with color scales
Creating colored data bars in Access forms
Building a data bar using ASCII block characters
Using the String function to repeat characters
Dividing data values to adjust bar length
Handling null values with the Nz function
Creating calculated fields for progress bars in queries
Adding a calculated data bar field to a form
Setting form record source to use a query
Formatting form fields to fit data bars
Applying conditional formatting to data bars
Using expressions in conditional formatting rules
Changing the foreground color of text controls
Locking and removing tab stops from form controls
Removing padding and setting field transparency
Adjusting field size and layout for visual appealPrimary Topics Access forms, data bars, color scales, conditional formatting, ASCII characters, query design, visual indicators
Secondary Topics progress bar methods, ActiveX controls, form design tips
|