From out there on the moon, international politics look so petty. You want to grab a politician by the scruff of the neck and drag him a quarter of a million miles out and say, "Look at that!"
I want to format a single gridline in my excel bar graph.
I understand that to do this you: "Right click on a gridline, and select format axis. Find the box that says "Horizontal line crosses at:" and enter the value of the gridline you want to format differently than the others. It will now be selectable separately from the other gridlines, and so can be formatted separately from the other gridlines."
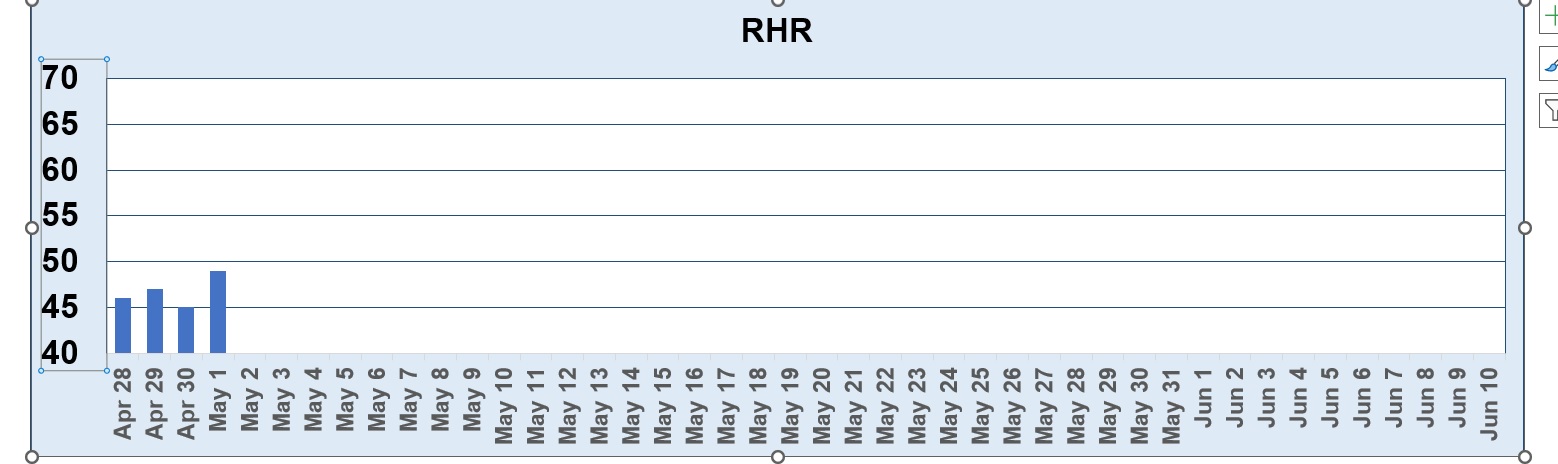
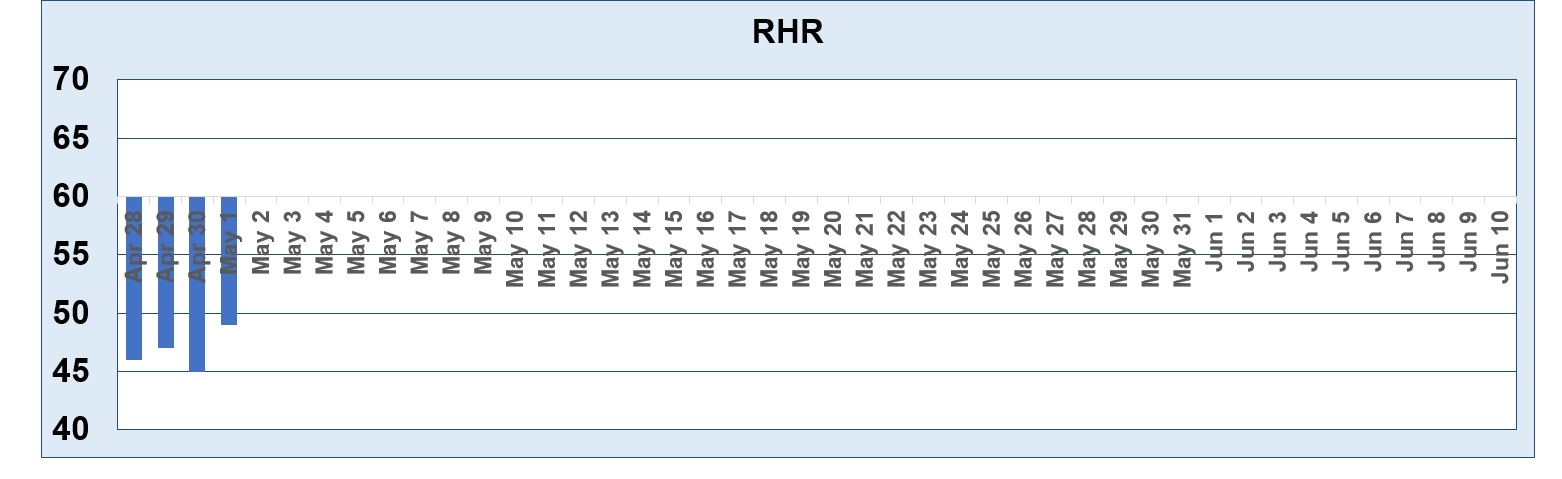
This is not working for me. I right click on gridlines and select Format Axis. Under Horizontal axis crosses I select Axis Value and input 60.
I want to be able to format the 60 gridline. However the entire horizontal axis jumps up to 60.
Sorry, but I don't know of any way to change just ONE gridline like that. You can change individual data points (bars) but not the gridlines. If you find a way, let me know. Here's a trick I found online, but I haven't tried it.
Carol HerriotOP
@Reply 3 years ago
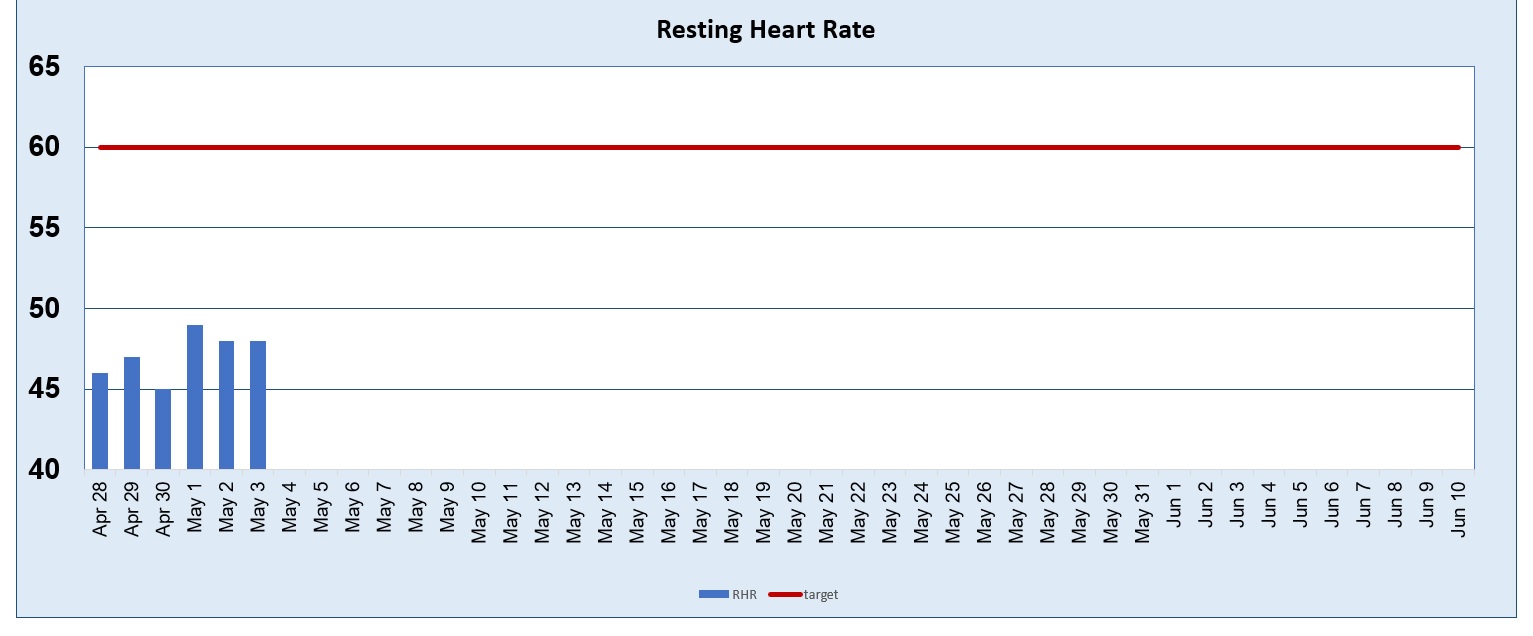
Thank you Richard: Just to let you know I figured out how to do it by adding a new column in my worksheet called target and entering 60 throughout.. Then I changed it to a combo chart and changed formatted the grid line to a different colour.
If you are a Visitor, go ahead and post your reply as a
new comment, and we'll move it here for you
once it's approved. Be sure to use the same name and email address.
This thread is now CLOSED. If you wish to comment, start a NEW discussion in
Excel Forum.