Stock History
By Richard Rost

 5 years ago
How to Get Stock History Data in Excel 365
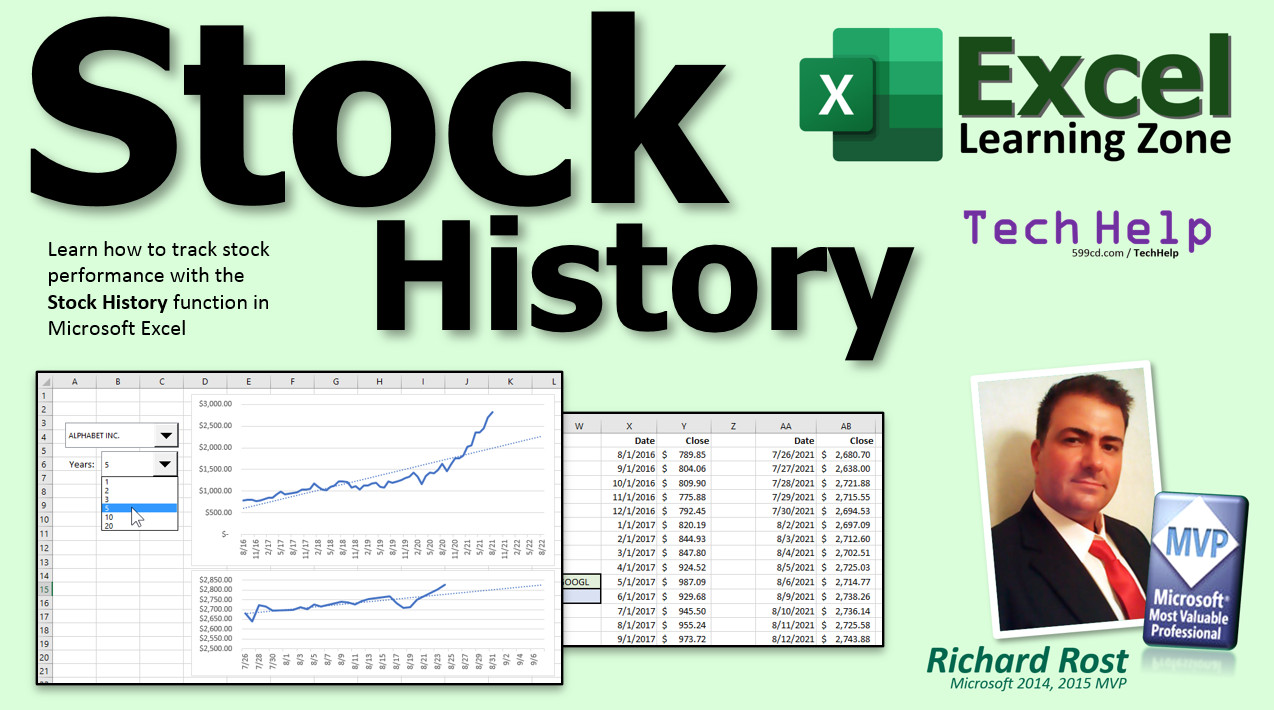
In this video, I'm going to show you how to use the STOCKHISTORY function in Microsoft Excel 365 to view the complete history of any stock in your portfolio. We will also create a line chart with a trendline so you can predict its future performance.
Roger from Riverside, California (a Gold Member) asks: I loved your video on tracking my stock portfolio. Thank you. Is there any way that I can pull up a history of a particular stock's performance so I can see how it's trending?
Members
Members will learn how to create drop-down lists (combo boxes) to select a stock from their portfolio sheet, and the number of years they'd like to see the chart plotted for. We'll also add a second 30-day chart for comparison.
Silver Members and up get access to view Extended Cut videos, when available. Gold Members can download the files from class plus get access to the Code Vault. If you're not a member, Join Today!
 Links Links
Learn More!
Questions?
Please feel free to post your questions or comments below. Thanks.
Keywords
microsoft excel, ms excel, #excel, #msexcel, #microsoftexcel, #help, #howto, #tutorial, #instruction, #learn, #lesson, #training, how do i get stock history in excel, STOCKHISTORY function, excel 365, microsoft 365, advanced excel tricks, excel for analysts, stockhistory formula, excel stockhistory function, historical stock data excel, combo box, drop-down lists, historic data, stock history function excel, stock hstory excel, microsoft excel tutorials, Microsoft Excel, Excel 2016, Excel 2013, Excel 2019, excel online course, excel tips and tricks
 Subscribe to Stock History
Get notifications when this page is updated
Intro In this video, I will show you how to use the STOCKHISTORY function in Microsoft Excel 365 to track the historical performance of stocks. We'll look at setting up your spreadsheet to pull stock data for different time periods, switching between daily and monthly views, making it easy to view any stock's performance, and creating a simple line chart with a trendline to visualize trends over time. This video is ideal for anyone interested in using Excel to analyze stock data and track portfolio performance.Transcript Welcome to another TechHelp video brought to you by ExcelLearningZone.com. I am your instructor, Richard Rost. In today's video, I'm going to show you how to track stock performance with the stock history function in Microsoft Excel.
Today's question comes from Roger in Riverside, California, one of my Gold members. Roger says, "I loved your video on tracking my stock portfolio. Thank you." You're welcome. Is there any way that I can pull up a history of a particular stock's performance so I can see how it's trending?
Yes, of course. Roger, Excel 365 has a great function called stock history that you can use to get a past performance of all of the stock's closing values, opening values, and more, going back as many years as you want. I'm going to show you how to do that in this video.
First up, if you haven't watched my stock portfolio video, go watch that first. You don't really have to, but it goes before this one. I'll put a link down below in the description below the video. Go click on that, go watch that, and then come back here.
The stock history function only works in Excel 365, so you have to have an Excel 365 subscription from Microsoft. You can't use the older versions of Excel or the standalone Excel 2019. However, if you do any stock analysis whatsoever in Excel, it's definitely worth the price of a subscription.
Let's begin by putting in which stock we want to check. I'll put "Stock" in A1 and then a ticker symbol like "MSFT" to check Microsoft. Let's put in a start date, which is going to be, let's go back five years. I'll put in here 11, 2016, let's say. It's currently 2021. I know sometimes these videos get watched 10 years in the future. I've got some of my old YouTube videos that people are still commenting on from 2007.
We'll make the end date today. Let's come over here, and we're going to use the stock history function now to grab all of that stock data. I'm going to say =stockhistory(, put your stock in there, comma, your start date right there, comma, your end date will be today, just like that. There are some other parameters; we'll talk about those in a minute. Press enter.
It says "busy" for a second, and then this table fills in with stock data. Let's just make this a little bit wider so we can see all that information. There's a ton of information here if you scroll down. We're getting every day's worth of information. For a long-term trend, you probably don't need that much information.
Let's say I only want to see this stuff monthly. Show me every month. Go up here to stock history, then right after "today" but before the closing parenthesis, hit comma, and then we're going to pick "monthly," which is 2. Press enter, and there we go. It's a little better now. It gives us the monthly stock prices, which is better for a long-term trend. We're going back five years and don't need to see every day.
It would also be nicer if, instead of putting an actual date in here, I could say "show me the past year, the past five years, the past ten years" by just putting a number in there. That would be easier. Let's come down to cell A3, type in "Years," and then put in "1" in there. I like to left justify this stuff.
Let's go up and edit the formula. Click right here. You have to click here, by the way. You can't just click anywhere inside this table. You have to click in cell D1, the upper left corner of it.
Now we're going to change this. Instead of an actual date, we're going to say today minus a certain number of days. So, today's date minus how many days? How many years is it? Put in parentheses: B3 times 365. I know it's not exactly leap years, but for stock forecasting, it's good enough.
We're going to say 365 times B3 is the number of years you want to go back from today. There you go. There's one year worth of data. The size of the table will change depending on how much data is in there.
Now we don't need those anymore. Just highlight those cells, right-click, delete, and we'll shift cells up. There we go. You want to change this easily to five years? Watch, put in "5." Boom. You get five years of the data. That's pretty cool. Want to change your stock real quick? Just put in "IBM." Enter. Done.
Now, looking at all these numbers is a pain. Let's chart it. Let's make a little chart right here, a little line chart. There are all kinds of advanced charts. You can do top bottom charts, and I spend lots and lots of time in my full Excel classes going over all the different kinds of charts. But we're just going to do a simple line chart.
It's easier to create this chart if we just go with one year of data. So put "1" there. It's a nice, smaller chart to create. Watch, you'll see the trick in just a minute.
Now I'm going to select this chart. Just highlight that entire chart right there. Go to Insert, and then under the chart types here, pick the Line chart. Just pick that first one and you can see the preview right behind there. Click on it and there you go. There's your little chart. Drag it out like that. Not too fancy.
Instead of "Close" up here, let's change that to maybe "Stock Performance" or whatever you want to call it. So there's my chart. One year worth of data here.
Now, if you try changing this back to five years, what happens is the range of this chart hasn't changed. See, if you click here, it's still that beginning box there. You want to resize the parameters of this chart for the biggest period you think you're ever going to check. And unfortunately, no, you can't just select the whole column. It doesn't work. There's a long story behind it.
So let's go over here. I think 10 years is probably big enough for pretty much every stock. Or if you want to go crazy, make it 20 years. Let's go 20 years with the data. Some of them go back pretty well. I usually find personally, I'm not a major investor. I dabble. But I think five years of performance is enough unless you're dealing with a really old company. Five years is usually good enough to see a trend. But if you want to do 20, that's fine.
Now, how far down does 20 go? Scroll down. That's going to be 20 times 12, whatever that number is. I went too far. So we're down to, there you are, 242. Remember that number - 242. E242 is the bottom boundary of our chart. This is as big as it's ever going to get.
Click on the outline of the chart, go to Chart Design, Select Data, and right here, we're going to change this to E242. Press enter. There you go. There's all 20 years of performance.
The nice thing about it is if I go back and change this back to, say, "5," the chart will deal with it. See, we only have five years of data here now, but the chart adjusted accordingly. If the range is too big, that's fine. It'll scale the chart down. You just can't go over 20, but I don't think you're ever going to go over 20, anyway. Here's 10 years. There's 10-year performance. IBM's kind of sliding.
If you want to see what the trend is, let's add a trend line. Come in here, right-click, go to Add Trendline. There it is. Linear is usually what I use for stock analysis. I talk about the other types in my classes in detail. If you scroll down, you can go forward and get a forecast. How many periods in the future do you want to forecast? These are months. Let's forecast it out 12 months in the future. Close that. There you go. There's their trend line going out 12 months in the future.
Let's change the company. Let's go to Microsoft again - MSFT. Enter. There's Microsoft's performance. So there you go. That's how you can get a quick stock performance for any stock, any number of years. Here's the data, here's a chart with a trend line, so you can see how the stock is performing.
I talk a lot more about all the different chart types and options and all this different stuff in my Excel Beginner Level 4 class. I show you pretty much everything you need to know about charts: pie charts, line charts, and bar graph charts. Then we do a little bit with data tables, lots of stuff. Excel Beginner 4 - link down below in the link section.
If you want to learn more about stock history in Excel and the extended cut for members, which is 20 minutes long, I'll show you how to make dropdown boxes, combo boxes so you can pick the stock from your stock portfolio, which was from my stock portfolio sheet from the last Excel TechHelp that I did. We'll pick the number of years from a list here as well. That's why you can drop this box down here, pick someone like Delta. There it is. Pick the number of years you want to check - you want to go 10 years for a longer trend. The bottom chart will stay 30 days; that's always going to be your short-term, 30-day trend, and this guy changes for your long-term trend.
All of this comes from the portfolio that we made in the previous video. If you didn't watch that one, go watch this video too. That is all covered in the extended cut for members. All of the Members and up get access to all of my extended cut videos. Gold Members can download these sheets that I build.
Plus, if you do any work with Microsoft Access, I've got hundreds of videos for Microsoft Access in the TechHelp library as well.
How do you become a member? Click the Join button below the video. After you click the Join button, you'll see a list of all the different membership levels that are available, each with its own special perks.
Silver Members and up will get access to all of my extended cut TechHelp videos, live video and chat sessions, and other perks. Gold Members get access to download all of the sample spreadsheets that I build in my TechHelp videos, plus my Code Vault where I keep tons of different functions that I use and more. Platinum Members get access to all of the previous perks, plus all of my beginner full courses and one new expert course every week. These are the full-length courses found on my website and not just for Excel. I also teach Word, Access, Visual Basic, ASP, and lots more.
When you do sign up to become a member, I need you to email me and tell me, "I want more Excel." The vast majority of my videos are for Microsoft Access because that's been my focus for the past few years. However, I'm happy to add more Excel videos if I get more Excel members. So make your voice heard and I'll make lots more TechHelp lessons for Excel.
But don't worry - these free TechHelp videos are going to keep coming. As long as you keep watching them, I'll keep making more and they'll always be free.Quiz Q1. What Excel function is demonstrated in the video for tracking stock performance over time?
A. STOCKHISTORY
B. STOCKPERFORMANCE
C. HISTORYTRACK
D. DATAGRAB
Q2. Which version of Excel supports the STOCKHISTORY function?
A. Excel 2016
B. Excel 2019 standalone
C. Excel 365
D. Excel 2013
Q3. What type of data can you retrieve with the STOCKHISTORY function?
A. Only the current price
B. Opening and closing values, and more historical data
C. Only the opening price
D. Only dividend history
Q4. How can the user specify the period for the stock history in the example provided?
A. By selecting from a dropdown menu
B. By entering years in a specific cell, which is then used in the formula
C. By checking a box
D. By highlighting a chart
Q5. What does the number "2" represent when added as a parameter in the STOCKHISTORY function?
A. Daily interval
B. Weekly interval
C. Monthly interval
D. Yearly interval
Q6. What happens if you change the number of years input (from 1 to 5, for example) in the model?
A. The entire table and chart automatically update to show the new period
B. Nothing changes until you restart Excel
C. Only the first row updates
D. You have to re-enter the entire formula
Q7. Why does the instructor recommend setting the chart's data range for the maximum period you might want to analyze?
A. Because Excel automatically knows the chart size
B. So the chart can handle changes in data size without resizing each time
C. Because you can only create charts for one year of data
D. So you don't have to use formulas
Q8. What type of chart is created in the video to visualize stock performance?
A. Pie chart
B. Bar chart
C. Line chart
D. Scatter plot
Q9. What additional tool is added to the chart to predict future stock performance?
A. Conditional formatting
B. Trendline with forecast
C. Pivot table
D. Sparklines
Q10. According to the instructor, why might five years of stock performance data be sufficient for most users?
A. Because Excel cannot handle more data
B. Because most companies only provide five years of data
C. Because five years usually shows a sufficient trend for general analysis
D. Because daily data is too detailed
Q11. What does the instructor suggest as a way to allow users to quickly select different stocks or periods in the extended members version?
A. Creating new worksheets for each stock
B. Adding dropdown/combo boxes for stock symbols and years
C. Manually editing formulas each time
D. Importing data from an external website
Q12. What is one of the perks for Gold Members of the site?
A. Access to only the free videos
B. The ability to download the sample spreadsheets used in the videos
C. Discounts on Excel subscriptions
D. Personal weekly coaching sessions
Q13. What should new members do if they want more Excel-related content?
A. Post a comment on YouTube
B. Email the instructor saying "I want more Excel"
C. Only watch Access videos
D. Join the Platinum level
Answers: 1-A; 2-C; 3-B; 4-B; 5-C; 6-A; 7-B; 8-C; 9-B; 10-C; 11-B; 12-B; 13-B
DISCLAIMER: Quiz questions are AI generated. If you find any that are wrong, don't make sense, or aren't related to the video topic at hand, then please post a comment and let me know. Thanks.Summary Today's video from Excel Learning Zone focuses on using Excel's stock history function to track stock performance effectively. This feature is available exclusively in Excel 365, so you will need a current subscription to use it. Older versions such as Excel 2019 do not include this function, but if you are serious about stock market analysis in Excel, it is well worth considering an upgrade.
The stock history function allows you to analyze the performance of any stock by retrieving its historical data, including closing and opening prices over any date range you specify. To start, you simply enter your target stock's ticker symbol and the date range you want to examine. For instance, you might want to analyze Microsoft's (MSFT) stock over the last five years by specifying a suitable start and end date.
When you enter the stock symbol and choose your date range using the stock history function, Excel quickly generates a table containing daily stock data. You may notice that this results in a large volume of records, especially for an extended timeframe, and that is often more granular than needed for long-term trend analysis.
To address this, you can adjust the stock history function to aggregate the data monthly instead of daily. This makes it much easier to spot broader trends over several years. By navigating to the stock history function and adding a parameter for monthly frequency, your table will only include one row per month, leading to a much more manageable and useful view of your data.
To further improve usability, you can substitute the fixed start date with a more dynamic calculation based on the number of years you wish to examine. For example, by adding a "Years" input cell, you allow yourself or another user to simply type in the desired number of years, and the formula will calculate the start date by subtracting this value from today. This flexible approach saves time and eliminates the need for frequent manual adjustments.
Switching between different stocks or varying the length of time for analysis is just a matter of typing the new ticker symbol or the preferred number of years in the appropriate cell, with your results updating instantly. This structure is highly adaptable and user-friendly.
To visualize stock trends, you can create a simple line chart from the generated table. For charting purposes, it is easier to work with a smaller dataset, such as one year's worth of monthly data. Once your table is ready, you can insert a line chart, labeling it appropriately, such as "Stock Performance." The chart reflects the selected time period and provides a quick, visual assessment of how the stock has performed.
If you decide to switch to a longer period, like five or ten years, you will need to ensure the chart's data range covers the largest period you expect to analyze. Unlike some other operations in Excel, you cannot select an entire column for this chart. Instead, determine the final row of your largest possible data set and set the chart's data range accordingly. If you change to a shorter time frame, the chart scales down automatically, making it adaptable to your needs.
For deeper analysis, it helps to add a trendline to your chart. This gives a clear visual cue about a stock's overall direction. You can also forecast future values by adjusting the options on the trendline to extend out as many periods as you want, such as projecting twelve months into the future.
The stock history tool, combined with dynamic controls for selecting stock symbols and analysis periods, makes tracking and analyzing stock trends in Excel both powerful and straightforward. I cover many more advanced charting techniques and stock analysis tools in my Excel Beginner Level 4 class, which is a great resource if you are looking to further develop your skills in this area.
Also, in today's Extended Cut, I demonstrate how to use dropdown and combo boxes to allow users to select stocks and time frames more easily. This includes linking the process to your stock portfolio sheet from previous lessons, creating user-friendly options to analyze both short-term and long-term trends. I show you how all of this integrates with a worksheet you might have already built, and how to maintain a short-term chart while changing long-term trends dynamically.
Membership at different levels unlocks even more content: Silver Members gain exclusive access to extended cut TechHelp videos and live sessions, Gold Members can download all the sample files and access my Code Vault, and Platinum Members enjoy all the previous benefits plus access to all beginner courses and a new expert course each week across Office topics like Access, Word, Visual Basic, and more.
If you are interested in more Excel content, let me know when you join as a member, since I produce the majority of my content on Microsoft Access. However, with more Excel community interest, I am happy to expand the library of lessons on Excel as well.
You can always count on these free TechHelp videos to keep coming. As long as viewers find them helpful, I will continue creating more.
A complete video tutorial with step-by-step instructions on everything discussed here is available on my website at the link below. Live long and prosper, my friends.Topic List Entering a stock ticker symbol for analysis
Specifying start and end dates for stock data
Using the STOCKHISTORY function in Excel 365
Setting the frequency of stock data to monthly
Calculating date ranges based on the number of years
Using formulas to dynamically adjust start date
Changing ticker symbols for different stocks
Deleting and shifting cells to clean up data
Creating a line chart from stock history data
Adjusting chart ranges to accommodate different time periods
Adding a trendline and forecasting future periods
Switching between multiple stocks and updating charts automatically |