|
Excel 2010-Now Excel 2007 Excel 2003 |
Tips & Tricks Excel Forum Course Index CIG Excel Book |
|
|
|||||
|
|||||
|
Excel Expert 7 Pivot Tables, Filters, Grouping, Pivot Charts Welcome to Excel Expert 7. In this course you will learn how to create, edit, and customize pivot tables and pivot charts in Microsoft Excel. We'll discuss what pivot tables are and why they are useful, cover options for changing their layout and design, and show you how to group data, use slicers, and filter results. You will see how to summarize and analyze data efficiently, explore new features in later versions, and receive guidance on participating in student forums to get the most out of each lesson. Lessons
ResourcesLesson SummaryWelcome! Pivot Tables & Charts Guide - Welcome to Excel Expert Level 7. In this course we will focus on pivot tables, discussing what they are, why they are useful, and how to build and edit them. We will cover pivot table options, design and layout changes, creating pivot charts, and grouping data. We will also talk about features new in later versions, such as slicers, and review the different levels of courses available. Guidance will be provided on how to use the student forums and get the most out of the lessons by following along step by step.
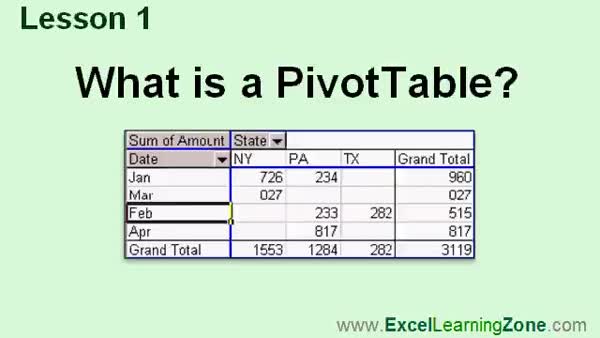
Lesson 1: Pivot Tables: Summarize Data - In Lesson 1, we will cover what a PivotTable is, why it is a valuable tool in Excel, and the types of questions it can help you answer. We will discuss how pivot tables let you easily summarize, analyze, and reorganize large amounts of data to reveal trends and relationships. We will also talk about how you can use pivot tables to format, filter, and present data in different ways, and how they make it possible to perform calculations such as sums and averages quickly without complex formulas.
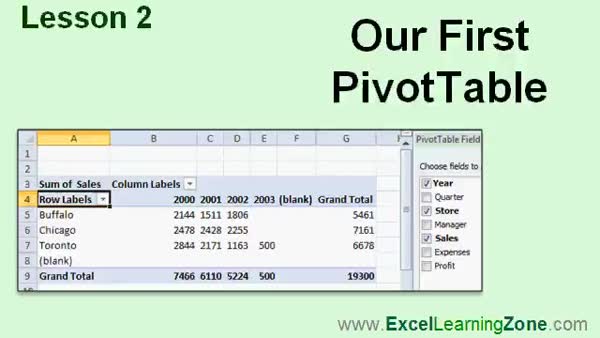
Lesson 2: Pivot Table: Summarize Sales by City - In Lesson 2, we will create our first PivotTable in Excel using sample sales data by city and year. I will show you how to set up the data, insert a PivotTable, and organize fields to summarize sales for each store and year, including how to adjust the layout and choose between different summary values like count or sum. We will discuss the roles of Row Labels, Column Labels, and Values, and briefly mention report filters and external data sources for future lessons. This lesson demonstrates how PivotTables provide a quick and easy summary of your information.
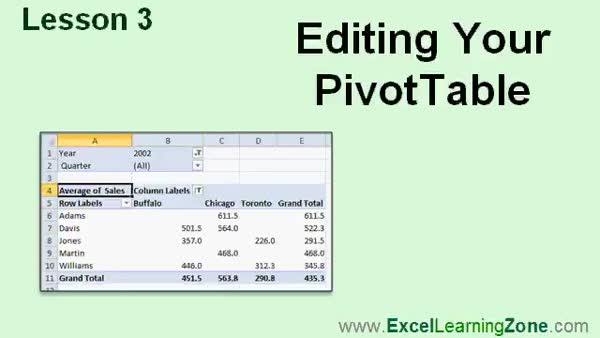
Lesson 3: Edit PivotTable Fields & Layout - In Lesson 3, we will walk through editing your PivotTable in Excel, including how to change fields, rearrange row and column labels, collapse and expand grouped data, and use value settings like sum or average. I will also show how to format, sort, and filter PivotTable data with label and value filters, as well as how to use report filters to filter the entire PivotTable without changing its structure. We will discuss some advanced filtering options and how dragging fields between axes allows you to easily pivot your analysis.
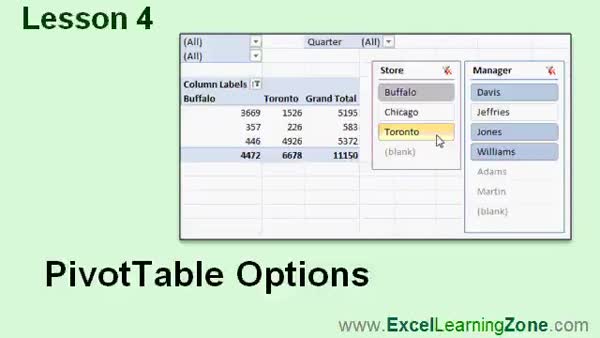
Lesson 4: PivotTable Fields, Filters & Slicers - In Lesson 4, we look at several PivotTable options in Microsoft Excel, including how to customize your PivotTable layout, adjust value fields such as sum, average, and count, and edit their display names. I show you how to work with filters, format fields, and modify settings like empty cell values and column auto-sizing. We also discuss grouping data, explore the different options available in the PivotTable Options menu, and see how to use the new Slicers feature to make filtering data easier for users. Slicers, field settings, and report filter arrangement are all demonstrated.
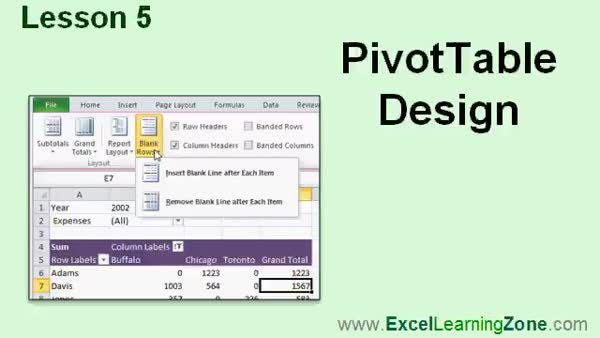
Lesson 5: PivotTable Design & Formatting - In Lesson 5, we will explore various PivotTable design options in Excel. I will show you how to use the Design tab to customize the appearance of your PivotTables, including working with subtotals, grand totals, report layouts, and blank rows. We will discuss how to change PivotTable styles and toggle features like banded rows and columns. I will also demonstrate how double-clicking PivotTable values can create a new sheet with the underlying data, which can be useful for tasks like generating mailing lists or examining specific records.
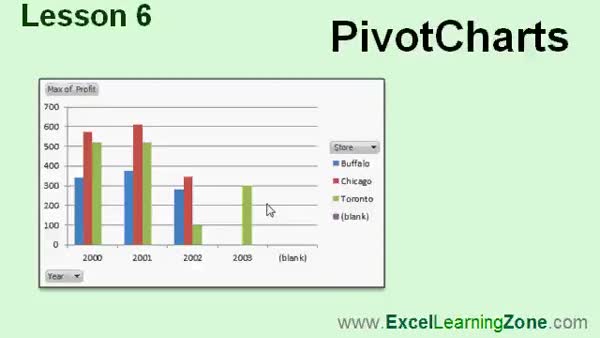
Lesson 6: Pivot Chart Creation & Customization - In Lesson 6, we will learn how to create a pivot chart, which is a visual representation of a pivot table. I will show you how to build a pivot chart from an existing pivot table and also how to create one from scratch directly from your data. We will walk through selecting chart types, applying filters, and adjusting value settings. We will also discuss the Pivot Chart Tools options, including moving the chart to its own sheet for printing. This lesson will help you understand the differences and similarities between pivot charts and regular charts.
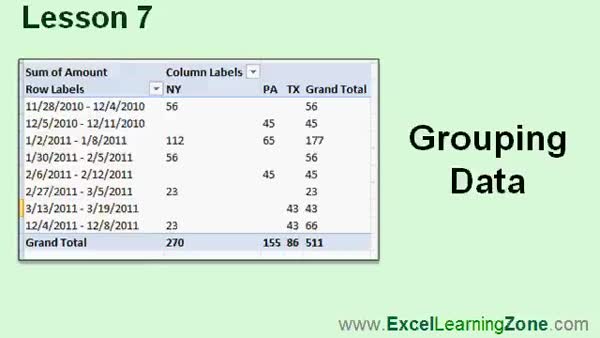
Lesson 7: Group by Date, Month, Year, Range - In Lesson 7, we will walk through grouping data in pivot tables, focusing on how to group dates by months, years, and custom ranges, as well as how to group numeric data into ranges like age groups. I will show you how to adjust the grouping options, address issues with static versus dynamic data ranges, and use features like subtotals and weekly grouping. We will also discuss the importance of using data tables or named ranges for automatic updates when your data changes. This lesson demonstrates practical techniques for grouping data efficiently in your pivot tables.
Lesson 8: Pivot Table Setup & Features - In this course we learned what a pivot table is, why pivot tables are useful, how to build basic pivot tables, and set up row and column labels, values, and change calculation functions. We covered editing pivot tables, working with multiple fields, collapsing or expanding levels, filtering and sorting data, and using label, value, and report filters. We discussed options like multiple value sets, slicers, pivot table design features, and creating pivot charts. We also learned to group data by dates or number ranges. Additional resources, support, and ways to provide feedback were mentioned for further pivot table learning.
NavigationKeywordsPivotTable, pivot chart, Excel, summarize data, analyze data, grouping data, slicers, filters, field settings, design tab, report layout, blank rows, banded rows, value fields, grand totals, subtotals, external data sources
TranscriptWelcome to Excel 2010 Expert Level 7, brought to you by ExcelLearningZone.com. I am your instructor, Richard Rost.Today's class is all about pivot tables. You'll learn what a pivot table is and why they're useful. You'll learn how to build a pivot table from scratch and how to edit a pivot table once you've built one. You'll learn about many of the different options available for pivot tables. You'll learn how to make design and layout changes to your pivot tables. You'll learn how to build pivot charts out of your pivot table data. And you'll learn how to create custom grouping levels for your data. This course was developed for Excel 2010. Most of what's covered is also valid in Excel 2007. There are a couple of features that were added in 2010, like slicers, that you won't have available in previous versions. If you're using Excel 2003 or earlier, the interface is much different. Go to my website at ExcelLearningZone.com and look for Excel 223 and 224 under the Excel 2003 category. Those two lessons cover pivot tables for Excel 2003 and earlier. This is an expert level course for Microsoft Excel. I strongly recommend that you take all of my beginner courses 1 through 5 before taking this course, and preferably my other expert classes 1 through 6 before starting this one. Many of the topics covered in those other classes will be necessary for today's class. My courses are broken up into four different groups: beginner, expert, advanced, and developer. The beginner courses are for novice users with little or no experience with Excel. The expert series, which is what you're watching right now, is designed for more experienced users who are already comfortable with Excel. Expert classes go into a lot more depth about each topic than the beginner classes did, and we'll cover more functions, features, tips, and so on. When you've mastered the expert classes, move up to the advanced lessons. You'll learn how to build macros, build user forms, create your own templates, and many more advanced features that not everyone will use, but they really add enhanced functionality and professionalism to your spreadsheets. Finally, my developer series is designed to teach you how to program in Visual Basic for Applications with Microsoft Excel. This will allow you to create Excel-based programs for your users, automate your spreadsheets, and integrate Excel tightly with the other Office applications. Each of my series is broken down into different levels. For example, the beginner series contains five different levels, which you should have taken previously. This class is the seventh level of the expert series. Each level teaches you new and different topics in Microsoft Excel, building on lessons learned in the previous levels. When you finish all of the expert classes, you'll move up to the advanced series, and finally the developer series. Now let's take a more detailed look at exactly what we're going to cover in today's class. In lesson one, we're going to learn what pivot tables are, why they're so useful, and what you can do with them. In lesson two, we'll create our very first pivot table. We'll create a table showing a list of sales, broken down by each city and by each year, with totals for each. Now that we know how to build a pivot table, in lesson three, we'll learn how to edit that pivot table. We'll see how to change fields, collapse and expand levels, filter and sort the data, and more. In lesson four, we'll take a look at some of the pivot table options, and we'll see a feature called slicers that is new in Excel 2010. In lesson five, we're going to look at some of the pivot table design options. In lesson six, we'll learn how to create a pivot chart, which is like a pivot table in chart format. In lesson seven, we're going to learn how to group data in our pivot tables. If you need help with the topics covered in today's lessons, feel free to post your questions in the Excel Interactive Student Forums. If you're watching this course using my custom video player software or online at my web theater, you should see the student forum for each lesson appear in a small window next to the class videos, if you have an active internet connection. Here, you'll see all the questions that the other students have asked, as well as my responses to them and the comments that some of the other students may have made. I encourage you to read through these questions and answers as you start each lesson. You can post your own questions and comments as well. If you're not watching your lessons online, you can still visit the student forums later by visiting ExcelLearningZone.com/forums. To get the most out of this course, I recommend you sit back, relax, and watch each lesson completely through once without trying to do anything on your computer. Then, replay the lesson from the beginning and follow along with my examples. Actually create the same spreadsheet that I make in the video. Build the spreadsheet with me step by step. Don't try to apply what you're learning right now to other projects until you've mastered the sample spreadsheet. If you get stuck or don't understand something, watch the video again from the beginning, or tell me what's wrong in the student forum. Most importantly, keep an open mind. Excel might seem intimidating at first, but once you get the hang of it, you'll see that it's really easy to use. IntroIn lesson 7 of my Microsoft Excel expert series, you will learn all about pivot tables in Excel 2010. I will show you what pivot tables are, why they are useful, and how to build and edit them from scratch. We will cover working with pivot table options, explore new features like slicers, make design and layout changes, create pivot charts, and group data in your tables. This lesson is designed for experienced Excel users who are ready to take their skills to the next level.QuizQ1. What is the primary topic covered in Excel 2010 Expert Level 7?A. Data validation techniques B. Pivot tables C. Spreadsheet security D. Conditional formatting Q2. Which feature is specifically new to Excel 2010 that is mentioned in the video? A. Charts B. Macros C. Slicers D. Data sorting Q3. What is recommended before taking this expert level course? A. Taking only advanced lessons B. Completing beginner courses 1 through 5 and expert classes 1 through 6 C. Using Excel for at least one year D. Reading the Excel user manual Q4. What is the suggested approach for working through the lessons in this course? A. Try to apply the lessons to all your projects immediately B. Skip the video and read the transcript C. Watch each lesson through once, then follow along and create the example spreadsheet step by step D. Only watch the lessons that seem interesting Q5. What will lesson two specifically teach you? A. How to create a macro B. How to build your first pivot table C. How to make Excel graphs D. How to set up workbook security Q6. What is the purpose of the Excel Interactive Student Forums? A. To download free templates B. To post questions, see other students' questions and instructor responses, and make comments C. To buy additional lessons D. To access Excel's official documentation Q7. In which lesson will you learn about grouping data in pivot tables? A. Lesson three B. Lesson five C. Lesson seven D. Lesson one Q8. Which type of user is the expert series designed for? A. Novice users with little or no Excel experience B. Experienced users already comfortable with Excel C. Only professional programmers D. Users who have never used spreadsheets Q9. What happens after you complete all expert level classes according to the course structure? A. You repeat the expert lessons B. You move up to the advanced lessons C. You stop taking Excel courses D. You start over with the beginner lessons Q10. What advice does the instructor give if you do not understand something in a lesson? A. Ignore it and move on to the next lesson B. Watch the video again from the beginning or ask for help in the student forum C. Contact Microsoft support directly D. Skip lessons that are difficult Answers: 1-B; 2-C; 3-B; 4-C; 5-B; 6-B; 7-C; 8-B; 9-B; 10-B DISCLAIMER: Quiz questions are AI generated. If you find any that are wrong, don't make sense, or aren't related to the video topic at hand, then please post a comment and let me know. Thanks. SummaryToday's video from Excel Learning Zone covers Expert Level 7, which is all about pivot tables in Microsoft Excel 2010. I'm Richard Rost, your instructor for this course, and in this session, I'll be guiding you through everything you need to know about pivot tables, starting from the basics all the way up to more advanced features.We'll begin by looking at what a pivot table is and why it can be such a powerful tool for analyzing your data. I'll show you how to create a pivot table from scratch, and once we have one set up, I'll walk you through the process of editing your pivot table. This includes modifying which fields are included, expanding and collapsing data, and using sorting and filtering options. We'll also explore many of the options available within pivot tables. You'll see how to change the design and layout to make your reports clearer and easier to understand. Part of this will involve looking at slicers, which were introduced in Excel 2010 and allow you to interactively filter your pivot tables. If you're using an earlier version of Excel, such as 2007, most of the features in this course still apply, though slicers and a few other options will not be available to you. If you're using Excel 2003 or an older version, the user interface is quite different, so for those cases, I recommend checking out courses Excel 223 and 224 under the Excel 2003 category on my website, where pivot tables for older versions are covered in detail. This is an expert-level course, so I strongly suggest that you have already completed the first five beginner courses and the previous six expert courses. The concepts and skills taught in those classes are necessary for you to get the most out of today's material. My curriculum is structured into beginner, expert, advanced, and developer levels. The expert level, where we are now, is geared towards users who already feel comfortable with Excel and are ready to learn more about its functions and tools in greater depth. After completing the expert series, you can move on to the advanced courses, which introduce additional features like macros, user forms, and templates and help you add more professional capabilities to your spreadsheets. Finally, there is the developer series, which is dedicated to learning how to program in Visual Basic for Applications (VBA) and fully automate your work in Excel or integrate it with other Office applications. Each series is organized into different levels. We've already covered five beginner levels, and this class is the seventh in the expert series, building on previous material to help you steadily increase your knowledge of Microsoft Excel. Once you've completed all the expert classes, you can proceed to advanced and developer topics. Now let's look at exactly what we will cover in today's class. Lesson one explains what pivot tables are, their usefulness, and the kinds of tasks you can accomplish with them. In lesson two, we will build our very first pivot table, creating a report that lists sales by city and by year, complete with totals. Lesson three covers editing pivot tables, including adjusting fields, collapsing and expanding your data, filtering, sorting, and more. Lesson four examines various options for pivot tables, including slicers, that allow you to visually control which data is displayed. In lesson five, we discuss different design and layout choices you can make for your pivot tables. Lesson six introduces pivot charts, which are graphical representations of your pivot table data. Then in lesson seven, we'll talk about grouping data within your pivot tables, so you can create custom levels and organize your information more effectively. If you need assistance with the material at any point, you can post questions in the Excel Interactive Student Forums. If you are using my custom video player or watching the lessons online in my web theater, the student forum for each lesson should appear right next to the class video as long as you are connected to the internet. There, you can see questions and answers from other students as well as my own responses. I encourage you to review these before starting each lesson and to participate by adding your own questions or comments. For those not watching the lessons online, the forums are still accessible by visiting my website at ExcelLearningZone.com. To maximize your learning, I recommend watching each lesson all the way through once before trying anything on your own computer. Then, go back and follow along step by step, creating the same sample spreadsheet that I demonstrate in the session. Once you have mastered the provided example, you can start applying what you've learned to your own projects. If you have trouble or something doesn't make sense, watch the lesson again from the beginning, or ask for help in the student forum so I can help you resolve any issues. Above all, keep an open mind. While Excel can seem overwhelming at first, once you practice these skills you'll find it becomes much more manageable. You can find a complete video tutorial with step-by-step instructions on everything discussed here on my website at the link below. Live long and prosper, my friends. Topic ListWhat a pivot table is and its usesBuilding a pivot table from scratch Creating a sales summary by city and year Editing pivot table fields Collapsing and expanding pivot table levels Filtering and sorting pivot table data Exploring pivot table options Using slicers in Excel 2010 pivot tables Customizing pivot table design and layout Creating pivot charts from pivot table data Grouping data in pivot tables Primary Topicspivot tables, creating pivot tables, editing pivot tables, pivot table options, slicers, pivot table design, pivot charts, grouping dataSecondary TopicsExcel 2010 new features, filtering and sorting, user forums, course navigation |
||
|
| |||
| Keywords: PivotTable, pivot chart, Excel, summarize data, analyze data, grouping data, slicers, filters, field settings, design tab, report layout, blank rows, banded rows, value fields, grand totals, subtotals, external data sources PermaLink How To Build, Edit, and Design Pivot Tables with Pivot Charts and Grouping Data in Microsoft Excel |