Stock Portfolio
By Richard Rost

 5 years ago
Track Your Stock Portfolio in Microsoft Excel 365
In this video, I'll show you how to track your stock portfolio in Microsoft Excel, and get real-time price updates from the Internet. We'll calculate our total profit and percent gain. This feature is only available for Microsoft 365 subscribers.
Xander from Omaha, Nebraska (a Gold Member) asks: A friend of mine told me that you can get current stock prices in Excel automatically. Can you show me how to do that?
Members
Members will learn how to format the stock data as a table which makes updates much easier. We will also see how to use conditional formatting to make the data easier to visualize. We'll see how to pick a stock when Excel doesn't guess the name correctly. Finally, we will record a macro and assign it to a button to refresh the stock data automatically.
Silver Members and up get access to view Extended Cut videos, when available. Gold Members can download the files from class plus get access to the Code Vault. If you're not a member, Join Today!
 After This... After This...
Links
Learn More!
Questions?
Please feel free to post your questions or comments below. Thanks.
Keywords
tracking stocks in excel, get latest stock data in excel, stock portfolio, stock dashboard, pull live stock data, track your portfolio, investment portfolio tracker template, stock prices in excel, stock quotes
Intro In this video, I will show you how to manage and track a stock portfolio using Microsoft Excel. We will walk through setting up your stock list, importing real-time prices for your investments using Excel 365's stock data type, calculating values and profits, tracking gains, and refreshing your portfolio with current market data directly from the internet. I will also cover adding new stocks, formatting your sheet for easier viewing, and calculating totals for invested amounts, current value, profit, and gains. This straightforward guide is perfect if you want an easy way to update and monitor your investments in Excel.Transcript Welcome to another TechHelp video brought to you by ExcelLearningZone.com. I am your instructor Richard Rost.
In today's video, I am going to show you how to manage and track your stock portfolio in Excel. Once you have it all set up, you will be able to click one button and refresh the pricing right off the internet.
Today's question comes from Zander in Omaha, Nebraska, one of my gold members. Zander says, A friend of mine told me you can get current stock prices in Excel automatically. Can you show me how to do that?
Well, yes, Zander. I would be happy to show you how to do that now. What I am going to show you right now only works for people who have a Microsoft 365 subscription. If you have a different version of Excel, there is a way you can do it. I cover it in my Excel Beginner 5 class. I will put a link down below in the links section. But for the rest of you who have Excel 365, let me show you how to do it.
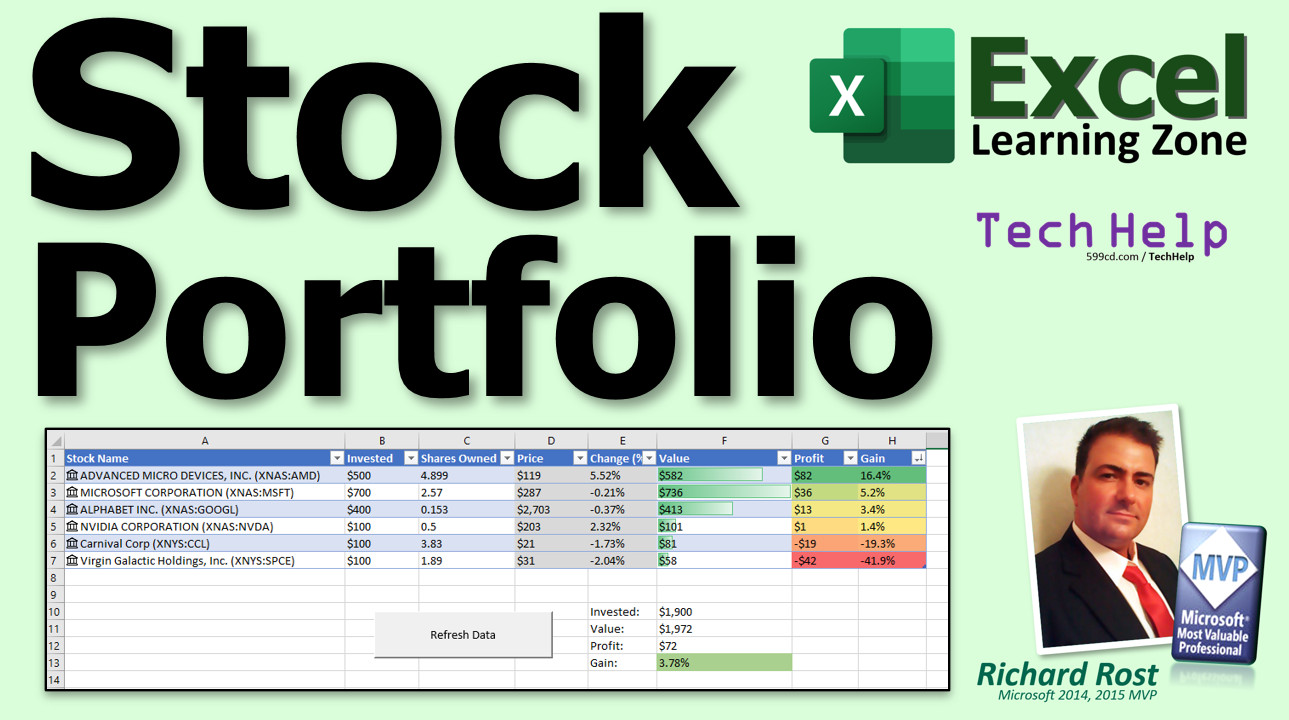
Here I am inside of Excel. Let's go ahead and type in the column header. This will be the stock name. I will just type in a couple of stocks that I have. Let's go with Microsoft MSFT, and then I have got AMD, and how about Google. Right about now you can see where Excel pops up that little thing that says convert to stocks. Do not click on that just yet.
Let's put another one in - how about Nvidia NVDA. That's good enough for now. Let's select these four stocks here. I am going to come up and click on Data, and under Data Types click on Stocks. I do not want to click on that link that pops up because you have to do one at a time.
Now, this disclaimer comes up and says financial market information is provided as is and is not for professional trading. If you are a professional trader, then you might want to invest in some better software. For the casual trader like me, I just do a little bit here and there. This is good enough. It is not real-time, minute-to-minute like professional traders want. If it is wrong, you cannot get in trouble with Microsoft, but it is good enough for the average casual investor.
I am going to close that and get rid of it. Let's widen out this column a little bit right there, and you can see Microsoft, AMD, Alphabet, and Nvidia. Make sure these are the right ones. There are different stock exchanges – sometimes it comes up with a different stock than the one you are planning on getting. Make sure to double-check.
Microsoft calls this stuff, by the way, rich data types. There are Stocks, Geography, and a whole bunch of other ones you can get installed too. If you come over here and click on this little building, it says Show Card. It gives you all the information about that stock - what the company is, their current price, what exchanges they are on, ticker symbol, percent changes, previous close, 52 weeks high and low, all this different stuff.
Let's go ahead and add the price to our sheet. Click on the little thing right here that says Extract Price to Grid. Click on that and right there, look at that, the price pops up. If you click on that, you will see it is A2.Price, and A2 is Microsoft. Just autofill this down, and there is the rest. Widen that out so you can see it all. That is the current price per share. Let's put Price up top.
What else is interesting? Let's do their percent change. I am going to click over here again, hit this little thing right there. Instead of hitting the little building, click on this guy that pops up. You can see all the different stuff in here too. Click Percent Change - you can see other stuff, employees, exchange, industry type, change percentage - boom, there it goes.
Click and drag it down, and there is your percent change. Now, that is all the data that you really need that is supplied over the internet. The rest is information you can supply. For example, how much did you invest?
Let's say you initially bought Microsoft, and you bought $700 worth. How many shares did you get for that? Let's say when you bought it, that was worth 2.57 shares. That is information you can get from your broker or from your app.
I personally use Cash App. You could say I want to invest ten bucks, twenty bucks and it will tell you if you go into details - there it will say how many shares you purchased. You can buy small pieces of a share.
Knowing that, now we can know what our value of our stock is. We now have this many shares, and each share is now valued at 286, so the total value of our investment is equal to the shares that we purchased times the price that they are currently worth. As you can see, they have gone up 36 bucks. We initially invested 700.
Now your profit is very easy to calculate. It is equal to value minus amount invested. Then we can calculate our gain, which is equal to your profit divided by the amount you invested. That should be formatted as a percentage, so you are up 5 percent. Let's increase the decimals there. All right, 5.19 percent. See that?
Let's put in some other numbers here. For AMD, let's say you invested 500 in AMD and when you bought it that got you 4.899 shares. Cash App will give you eight decimal points. You can type in as many as you want. I usually type in three or four. That is usually close enough. I do not need it to the exact penny. In fact, I am going to get rid of these pennies in a second.
These three things we can just autofill down, just like that, and we have to fill these numbers in. Your value here - we are up 16 on AMD. That is pretty good.
Alphabet, which is Google. Let's say you got 400 invested and that got you 0.153 shares. Then Nvidia, let's say you got 100 into that and that got you 0.5 shares.
Now let's do some formatting here. I am going to select all this stuff. I am going to align it all left. I like the format as currency. I am not a big accounting fan, so I go to currency and then I am going to drop the decimal points off so it is just rounded to the nearest dollar. Then I am going to click on one of these, hit the format painter, double click on the format painter so it is sticky, and then go Invested, Value, and Profit - we will format all those as the same dollar type.
And no, not all my investments came out good. I have got Virgin Galactic SPCE, there it is, comes right in. See, just type it right below there. Now that Excel sees that you are doing stocks in that column, it will automatically fill it in. I put 100 into Virgin Galactic and - oh yeah, that's the price, we have to get the price here. Sorry, let's drag these down. There we go. There are the current prices. You can always go to Data and hit Refresh, and it will refresh. You could watch these numbers change.
I am recording this now at 6:35 p.m., so we are outside of market hours. These will change throughout the day.
Invested - what did I invest? I invested 100 bucks, and at the time that bought me 1.89 shares. You can see I am losing money. I do not have a lot of money in the stock market - just a little bit, but it is more like a hobby for me.
Let's format this stuff down here. I am going to show in the extended cut for the members, I am going to show you how to turn this into a table, and one of the benefits of tables is that it carries all the formatting from row to row, so you do not have to keep changing formatting and autofilling down.
Some quick calculations at the bottom down here. Let's say the total invested is equal to the sum of what we have got invested right here. The value of our portfolio is equal to the sum of our value right there. Our total profit - you can either add up this column here or just go equals this minus that.
Then your gain is equal to your profit divided by invested. There you go. Format that as a percentage. I am up 5 percent, and these are not all my stocks, but it is just a small sample. You see how this works. Maybe add a splash of color on here too. Something like that. How does that look? All right, looks good.
That is it. That is the basics. That is how you do it. Then, throughout the day, if you want to check your portfolio, how you are doing, hit the Refresh button and then boom, that will update. You can either be happy, or it will ruin the rest of your day.
Want to learn more? In the extended cut for members, I will take you through a few more changes - 15 minutes long. We will format this as a table instead of just random cells, which has a lot of benefits. I will show you how to do some conditional formatting so your winners show up as green, you losers show up as red, and then yellow for the stuff in between. We will do some data bars, which are cool looking, and then we will make a button to refresh the data to go out to the internet and get updated pricing, so you do not have to go hunting through the ribbon if you are sitting on the Home tab.
Here is the updated sheet. Here are the data bars. Those are cool looking. Here is the button to refresh the data. Click on that and then boom, that updates for you. That is all covered in the extended cut for the members.
Silver members and up get access to all of my extended cut videos. How do you become a member? Click the Join button below the video. After you click the Join button, you will see a list of all the different membership levels that are available, each with its own special perks.
Silver members and up will get access to all of my extended cut TechHelp videos, live video and chat sessions, and other perks. Gold members get access to download all of the sample spreadsheets that I build in my TechHelp videos, plus my Code Vault where I keep tons of different functions that I use and more.
Platinum members get access to all the previous perks plus all of my beginner full courses and one new expert course every week. These are the full-length courses I have on my website and not just for Excel. I also teach Word, Access, Visual Basic, ASP, and lots more.
When you sign up to become a member, I need you to email me and tell me you want more Excel. The vast majority of my videos are for Microsoft Access because that has been my focus for the past few years. However, I am happy to add more Excel videos if I get more Excel members. Make your voice heard and I will make lots more TechHelp lessons for Excel.
Do not worry - these free TechHelp videos are going to keep coming. As long as you keep watching them, I will keep making more, and they will always be free.Quiz Q1. What is the main topic of this TechHelp video?
A. Setting up a personal budget in Excel
B. Tracking your stock portfolio and refreshing prices in Excel 365
C. Creating invoices in Excel
D. Managing employee schedules with Excel
Q2. Which version of Excel is required to use the automatic stock data feature shown in the video?
A. Excel 2010
B. Excel Online (free version)
C. Microsoft 365 subscription version of Excel
D. Excel for Mac 2011
Q3. What is the purpose of the "Data Types" Stocks feature in Excel 365?
A. To display population statistics for cities
B. To automatically pull and refresh stock data like price and percent change
C. To format currency fields
D. To generate charts automatically
Q4. Why should you double-check that Excel links to the correct stock?
A. Only Microsoft stocks are reliable
B. There can be multiple companies with similar names or ticker symbols
C. Stock prices may be incorrect
D. You have to manually enter the exchange
Q5. In order to add a stock price column to your sheet, you should:
A. Enter the prices manually each day
B. Use the Extract Price to Grid feature after converting tickers to Stocks data type
C. Use a third-party add-on for real-time quotes
D. Email your broker for updated prices
Q6. To calculate the value of your stock holdings in the spreadsheet, you need to:
A. Multiply the number of shares by the current price per share
B. Add together the invested amount and the price
C. Subtract invested from price
D. Multiply by the percent change
Q7. How do you calculate profit for each stock in the example?
A. Invested amount minus value
B. Value minus invested amount
C. Shares multiplied by price
D. Value divided by shares
Q8. To show the gain as a percentage, which formula is used?
A. (Profit / Invested Amount)
B. (Value / Profit)
C. (Price / Shares)
D. (Invested Amount / Value)
Q9. What formatting option does the instructor prefer for currency values?
A. Accounting format with two decimal places
B. Currency format with decimals removed
C. Scientific notation
D. Text format
Q10. What happens when you add a new stock ticker under your existing list in Excel 365?
A. Excel will ignore the new entry
B. Excel automatically detects it as a stock and pulls in data when refreshed
C. You have to reapply formatting every time
D. You cannot add more stocks after initial setup
Q11. How do you update your stock prices and other linked data throughout the day?
A. Re-enter the tickers by hand
B. Click Data and then Refresh to update the information
C. The prices update automatically every minute
D. You need to open a new spreadsheet
Q12. What are some features covered in the extended cut for members?
A. Turning the list into a table for better formatting management
B. Conditional formatting with color coding
C. Adding a button to refresh data
D. All of the above
Q13. Which TechHelp membership tier gives access to downloadable sample Excel workbooks and the Code Vault?
A. Free users
B. Silver members
C. Gold members
D. Platinum members
Q14. What message does the instructor have for viewers wanting more Excel lessons?
A. Sign up for the newsletter
B. Email him after signing up for membership to request more Excel content
C. Download the free PDF
D. Comment on the YouTube video
Answers: 1-B; 2-C; 3-B; 4-B; 5-B; 6-A; 7-B; 8-A; 9-B; 10-B; 11-B; 12-D; 13-C; 14-B
DISCLAIMER: Quiz questions are AI generated. If you find any that are wrong, don't make sense, or aren't related to the video topic at hand, then please post a comment and let me know. Thanks.Summary Today's video from Excel Learning Zone focuses on how to manage and track your stock portfolio using Excel. Once all the setup is complete, you'll be able to refresh and update your stock prices from the internet with just a single click.
One of my students recently asked if it was possible to get real-time stock prices directly in Excel. The answer is yes, but what I'm going to demonstrate today is specifically for users with a Microsoft 365 subscription. If you're using another version of Excel, there are alternative methods, and I cover those in my Excel Beginner 5 class. You can find a link to that class on my website.
For those of you using Excel 365, here's how you can get started. Begin by setting up your spreadsheet with a column for your stock names or ticker symbols. Enter a few examples, such as Microsoft (MSFT), AMD, Google, and Nvidia (NVDA). After typing in your stock symbols, select the range where you've entered them. Then, go to the Data tab, and under Data Types, select Stocks. Make sure not to use the auto-suggested conversion that pops up for each entry, since it forces you to select them individually.
A disclaimer will appear, explaining that the financial data provided is not intended for professional trading purposes. If you're just a casual investor, as many of us are, this functionality will be more than sufficient. For those who require minute-by-minute updates, more advanced tools may be necessary.
Once the stocks have been recognized, you'll see their company names fill in. Double-check that Excel has correctly identified each stock, as sometimes the data may pull from different exchanges or show the wrong company.
Excel calls these imported financial datasets "rich data types." With these, you can view comprehensive information about each stock, such as the company's full name, current price, ticker symbol, percent change, and much more. Clicking on the icon next to each entry brings up more detailed information.
You can now add the current stock price into your spreadsheet. This is easily done by extracting the price data to your sheet, which will fill in each row with the latest value for each of your stocks. Autofill those cells down to cover all the stocks you're tracking. This gives you up-to-date price information for every stock you entered.
Next, you can include additional columns such as percent change, investment amount, number of shares purchased, current value, profit, and gain. For each stock, fill in how much you originally invested and how many shares you initially received. For example, maybe you invested $700 in Microsoft and received 2.57 shares at the time. You can usually find this information in your brokerage app. Many services, including those like Cash App, allow you to invest specific dollar amounts, even if that means purchasing fractional shares.
With the number of shares and the current price, you can calculate the current value of your investment. Subtract what you originally spent from this value to find the profit. Divide that profit by your investment to calculate your overall return as a percentage. Consider formatting these values as currency and percentages for clarity, and remove extra decimal places for a cleaner look.
Continue adding your invested amounts and shares for each stock in your portfolio. Fill out the respective values, and Excel can calculate the up-to-date value, profit, and gain for each company. You can also format these columns so everything is easy to read and aligned, using currency style and removing any unnecessary decimal points.
If you want to track more stocks, simply add them to your list. As soon as you enter a new symbol under your stock column, Excel recognizes it and retrieves the associated company information. Just drag your formulas down to update the calculations and refresh the price data. Remember, you'll need to refresh the data periodically to see the latest prices, especially during trading hours. After hours, the numbers may not change until the markets reopen.
I've also shown how to summarize your portfolio at the bottom of the sheet. This can include the total amount invested, the current total value, your overall profit, and your total percentage gain. These calculations are straightforward using SUM and other basic functions. You might also want to apply some simple formatting or color to make key areas stand out.
That covers the basics of tracking your stock portfolio in Excel with real-time price updates. If you'd like to expand on this spreadsheet, the extended cut for members will walk you through turning this collection of data into an Excel Table, which brings benefits like automatic formatting and formula propagation when adding new rows. I'll also show you how to set up conditional formatting to highlight winning stocks in green, losers in red, and those in between with yellow. In addition, I'll demonstrate how to add data bars for quick visual reference, and create a convenient refresh button to update your pricing directly from the Home tab.
In the extended cut, you'll see how these features come together, making your portfolio tracker not only functional but visually appealing and easy to use. Members at the Silver level and higher get access to all these extended lessons, as well as live sessions, chat, downloadable spreadsheets, and more. If you're interested in membership, just check the Join options available on my website. Gold and Platinum members receive even more benefits like full downloadable courses and access to advanced content for not only Excel, but also Word, Access, Visual Basic, and web development.
If you'd like to see more Excel content, let me know when you sign up. While I primarily teach Access, I'm always happy to add more Excel lessons as demand increases.
And of course, you can continue to access all my free TechHelp videos as long as there is interest.
You can find a complete video tutorial with step-by-step instructions on everything discussed here on my website at the link below.
Live long and prosper, my friends.Topic List Creating stock portfolio headers in Excel
Entering stock ticker symbols
Converting cells to stock data types
Extracting current stock prices into the sheet
Adding percent change for stocks
Entering invested amount and purchased shares
Calculating current value of investment
Calculating profit and gain percentage
Formatting cells as currency and percentage
Using autofill to copy formulas
Refreshing stock data from the internet
Summing total invested, value, and profit
Basic sheet formatting for readability
Adding new stocks and updating data |