|
Excel 2010-Now Excel 2007 Excel 2003 |
Tips & Tricks Excel Forum Course Index CIG Excel Book |
|
|||||
|
Excel Beginner 4 Column, Line, Pie, 3D Charts, Tables, Dashboards Welcome to Excel Beginner 4. In this course you will learn how to create and format charts such as column, pie, and line charts in Microsoft Excel, adjust chart properties, and use legends, labels, and data tables to better organize your visual data. We will discuss working with data tables, explore styles and themes to update your spreadsheet's appearance, and see how to insert charts into Word documents. You will also learn how charts update as your data changes, and how to move and arrange charts within your workbook. Lessons
ResourcesLesson SummaryWelcome! Charts & Data Tables Basics - Welcome to Excel Beginner Level 4. In this course we will focus on working with charts in Microsoft Excel, including column charts, pie charts, line charts, and some 3D chart features. We will cover how to insert and format charts, adjust chart properties, add legends, labels, and data tables, and move charts within your workbook. We will also discuss how to work with data tables, use styles and themes, and insert charts into Word documents. This class builds on previous beginner levels and is designed for users who have completed Levels 1, 2, and 3.
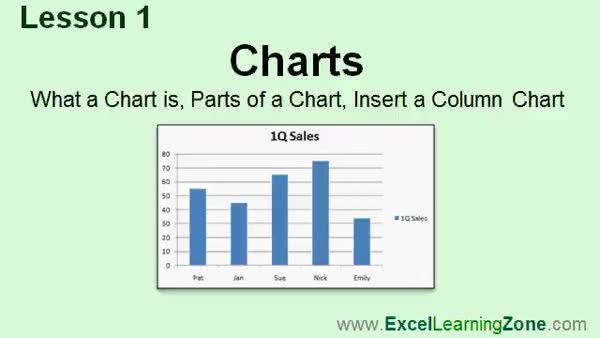
Lesson 1: Column Chart Data & Formatting - In Lesson 1, we will begin learning about charts, covering what a chart is, the different parts of a chart, and their uses for visualizing data in spreadsheets. We will discuss the chart area, data series, data points, axes, chart titles, legends, and gridlines, as well as briefly mention additional features found in more advanced charts. I will show you how to create a basic column chart in your spreadsheet, select and format chart elements, and introduce the Chart Tools tabs available for customizing your charts.
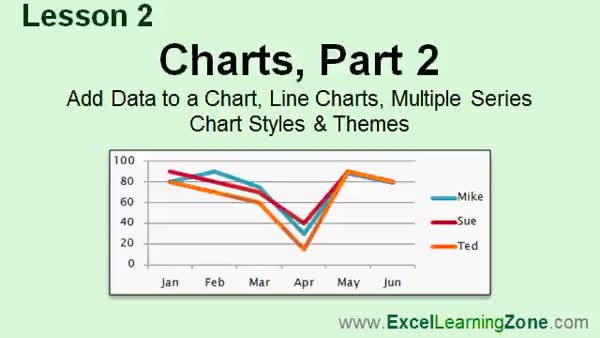
Lesson 2: Line Charts: Data, Series, Style - In Lesson 2, we continue working with charts by learning how to add new data to existing charts without starting over, create a line chart, and manage charts with multiple data series. We will walk through using chart tools to easily adjust data ranges, as well as how to quickly change the look and feel of your charts in Microsoft Excel using chart styles and spreadsheet themes. We will also discuss how changes in styles and themes affect both the chart and the underlying spreadsheet, and see how charts help reveal trends in your data.
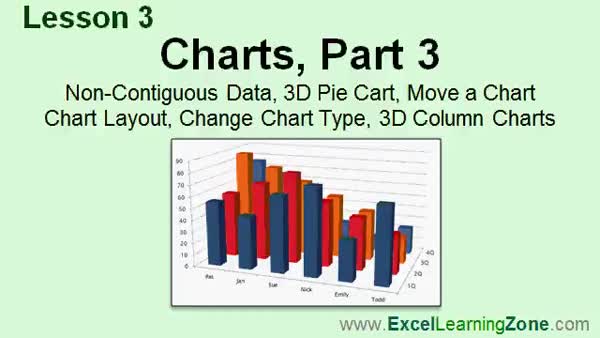
Lesson 3: 3D Pie & Column Charts, Move Sheets - In Lesson 3, we will cover how to create charts in Microsoft Excel using non-contiguous data, including selecting separate data ranges, and walk through creating a 3D pie chart that displays sales reps and their total sales. I will show you how to move a chart to a different sheet, discuss how to change chart layouts and types, and demonstrate how to create 3D column charts, including adjusting chart elements like titles and labels. We will also review how Excel charts automatically update when your data changes and test out various formatting and layout options available for different chart types.
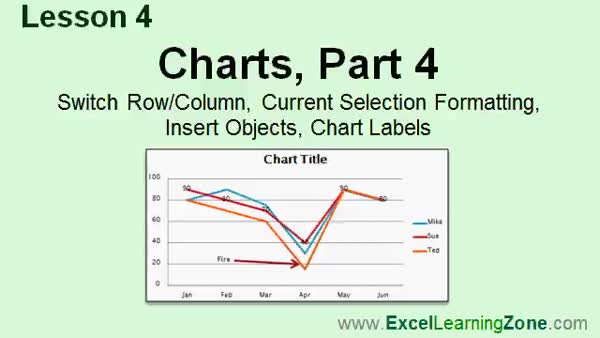
Lesson 4: Switch Axes & Format Labels - In Lesson 4, we will walk through how to switch the row and column axes in your charts, change and format the current selection, and insert objects such as pictures, shapes, and text boxes inside your charts. We will discuss adjusting various chart labels, including the chart title, axis titles, legend, and data labels. I will show you how to use the Chart Tools Ribbon, including the Design, Layout, and Format tabs, and demonstrate additional options for customizing your chart's appearance and organization.
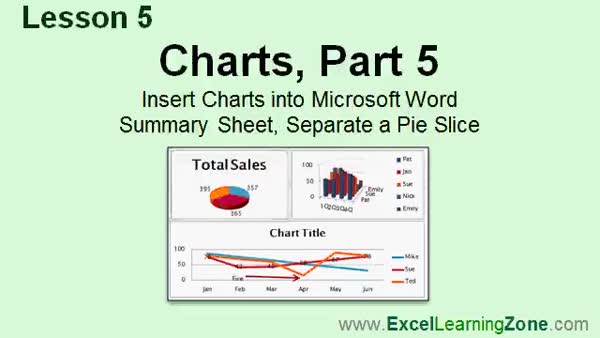
Lesson 5: Excel Charts: Insert, Summarize, Edit - In Lesson 5, we will walk through how to insert Microsoft Excel charts into a Microsoft Word document using copy and paste, adjust chart sizing, and discuss linking charts for automatic updates. We will also create a summary or dashboard sheet in Excel by moving multiple charts onto one sheet, ensuring the charts remain linked to their original data. Finally, I will show you how to separate a slice from a pie chart, move chart labels with leader lines, and briefly discuss rotating pie charts for better visibility.
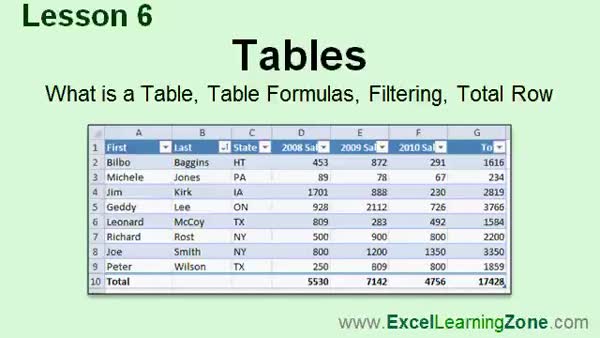
Lesson 6: Tables: Organize & Sort Data - In Lesson 6, we will learn about tables in Microsoft Excel, including what tables are, their benefits, and how they help structure and organize data. I will show you how to create a table, format it using built-in styles, and use table formulas, which automatically copy down and maintain consistency. We will discuss how to sort and filter data within your table, how to add a new total row, and how Excel adjusts totals based on your filters. You will also see how to add or remove rows and quickly change your table's appearance.
Lesson 7: Charts, Tables & Formatting - In this course we learned about working with charts and data tables in Microsoft Excel, including how to insert and format various types of charts, add multiple series, set up chart styles, and copy charts to Word. We covered selecting non-contiguous data, using 3D pie charts, customizing objects within charts, and creating summary sheets. We also discussed working with tables, table styles, formulas, sorting and filtering data, and setting up a total row. Finally, we reviewed the next steps for learning and how to get additional help or support with your Excel projects.
NavigationKeywordsExcel charts, Excel tables, column chart, line chart, pie chart, 3D chart, chart formatting, chart styles, chart themes, insert chart in Word, dashboard, chart labels, chart legends, switch axes, table formulas, sort filter Excel, table total row
TranscriptWelcome to Excel 2010 Beginner Level 4, brought to you by ExcelLearningZone.com. I am your instructor, Richard Rost.Today's class is mostly about charts. We will learn many different kinds of charts, including column charts, pie charts, and line charts. We will learn about some 3D charts. We will learn how to work with charts, move them around, and adjust some of their properties. We will learn how to format charts, change colors, and change axes. We will learn how to add legends, data labels, and data tables. There are all kinds of different things we can do with charts. We will also learn how to work today with data tables, where you can set up your data in a database-like format for consistent data entry and automatic copying of your formulas and lots more. This class is designed to be used with Excel 2010, a part of Microsoft Office 2010. If you are using an older version of Excel, you should visit my website at ExcelLearningZone.com and look for my older tutorials covering Excel 2000 through 2007. If you are using Excel 2007, you should have little difficulty following along, as most of the topics in this course are the same in 2007. But if you are using Excel 2003 or earlier, you really should either upgrade to Excel 2010 or purchase a tutorial for your version of Excel, which again you can find on my website. This class follows Excel 2010 Beginner Level 3, which I strongly recommend that you take before taking this course. Beginner Level 3 teaches you functions, including sum, average, max, and min, and we will be using some functions today when we set up our data tables. We also learn styles and themes in Beginner Level 3, and styles and themes are also important and will come into play today when we work with our charts and also our data tables. Beginner Level 3 also covers page layout, illustrations, pictures, clip art, and lots more. So again, I strongly recommend you take Beginner Level 3 before taking this class. This is the Beginner Level 4 course for Excel 2010. This class is for the novice user who has little or no experience with Excel outside of my Levels 1, 2, and 3 courses. In today's course, we will cover additional topics building on the lessons from the first three classes. My courses are broken up into four groups: Beginner, Expert, Advanced, and Developer. My Beginner courses are for novice users who have little or no experience with Microsoft Excel. They are designed to give you an overview of the basic features of Excel and cover just what you need to know to be productive. When you finish the basics, it is time to move up to the Expert series, which is designed for users who are already comfortable with Excel. Expert classes are designed to teach you more about all the standard features of Excel that people use from day to day, and will go into more depth about each topic than the Beginner classes. You will learn all about the options, alternatives, shortcuts, tips and tricks, and extra features that we might have skipped over in the Beginner lessons. When you have mastered the Expert classes, the Advanced lessons are for Excel power users. You will learn how to record macros, build user forms, create your own templates, and many more advanced features that not everyone will use, but they really add enhanced functionality and professionalism to your spreadsheets. Finally, my Developer level courses are designed to teach you how to program in Visual Basic for Applications with Microsoft Excel. This will allow you to create Excel-based programs for your users, automate your spreadsheets, and integrate Excel tightly with other Microsoft Office applications. Each of my series is broken down into different levels. For example, the Beginner series starts with Levels 1, 2, and 3, which you should have taken previously, and is followed by Level 4, which is this class, then followed by Level 5. Each level teaches you new and different topics in Microsoft Excel, building on the lessons learned in the previous levels. When you have finished all the Beginner classes, move up to the Expert series, then Advanced, and finally, Developer. Now let's take a more detailed look at exactly what we are going to cover in today's class. In Lesson 1, we are going to begin learning about charts. We are going to learn what a chart is, what they are used for, we will learn about the different parts of a chart, and we will see how to insert a column chart into our spreadsheets. In Lesson 2, we are continuing with charts. We will learn how to add data to an existing chart, how to create a line chart, how to work with charts that have multiple series, and how to quickly change the look and feel of our charts using chart styles and themes. In Lesson 3, we will learn how to chart non-contiguous data, we will create a 3D pie chart, we will learn how to move a chart to a different sheet, we will learn how to change chart layout and the chart type, and we will create some 3D column charts. In Lesson 4, we will learn how to switch the row and column axes, we will learn how to change the current selection and adjust the current formatting of that selected object, we will learn how to insert objects like pictures, shapes, and text boxes inside of our charts, and we will learn how to adjust all the different chart labels. In Lesson 5, we are going to learn how to insert our Microsoft Excel charts into a Microsoft Word document, so if you have a document that you are working on, you can include your Excel charts. We are going to build a summary sheet where you can see multiple charts at once from various pages in your workbook, all on the same summary sheet or dashboard, and we are going to learn how to separate a pie slice from the rest of the pie. In Lesson 6, we are going to learn about tables, we will learn what tables are and what they are used for, we will learn about the benefits of tables, we will see how to insert table formulas and how they are different from standard formulas, we will learn about filtering and sorting data inside our tables, and we will learn how to turn on a total row. If you need help with the topics covered in today's lessons, please feel free to post your questions in the Excel Interactive Student Forums. If you are watching this course using my custom video player software or online in my web theater, you should see the student forum for each lesson appear in a small window next to the class videos if you have an active internet connection. Here you will see all of the questions that other students have asked, as well as my responses to them, and any other comments that other students have made. I encourage you to read through these questions and answers as you start each lesson, and feel free to post your own questions and comments as well. If you are not watching your lessons online, you can still visit the student forums later by visiting ExcelLearningZone.com/forums. To get the most out of this course, I recommend you sit back, relax, and watch each lesson completely through once without trying to do anything on your computer. Then replay the lesson from the beginning and follow along with my examples. Actually create the same spreadsheet that I make in the video. Build a spreadsheet with me step by step. Do not try to apply what you are learning right now to other projects until you have mastered the sample spreadsheet. If you get stuck or do not understand something, watch the video again from the beginning or tell me what is wrong in the student forums. Most importantly, keep an open mind. Excel might seem intimidating at first, but once you get the hang of it, you will see that it is really easy to use. IntroIn lesson 4 of the Microsoft Excel 2010 Beginner series, you'll learn how to create and work with charts such as column, pie, and line charts, including basic formatting, moving, and customizing their appearance with colors, axes, legends, and data labels. We'll cover working with data tables to organize your information, set up database-like structures for easy data entry, use table formulas, and learn about sorting and filtering. You'll also see how to insert Excel charts into Microsoft Word documents and build summary sheets to display multiple charts together. This lesson builds on topics from the previous beginner levels.QuizQ1. What is the primary focus of Excel 2010 Beginner Level 4?A. Macros and automation B. Advanced database management C. Charts and data tables D. Programming in Visual Basic Q2. Which of the following chart types is NOT specifically mentioned as being covered in this course? A. Column charts B. Pie charts C. Scatter charts D. Line charts Q3. What feature is introduced in Lesson 6 of the class? A. Recording macros B. Data tables C. Conditional formatting D. Pivot tables Q4. In addition to inserting charts, what other chart-related skills are taught in this course? A. How to print charts B. How to adjust chart properties and format charts C. How to write VBA code for charts D. How to export charts directly to PDF Q5. Which Excel function topics, taught in Beginner Level 3, are relevant for this course? A. File management and data protection B. Sum, average, max, and min functions C. Hyperlinking and bookmarks D. Security and permissions Q6. What is recommended for students using versions of Excel older than 2007? A. Skip the course material entirely B. Watch tutorials for Excel 2010 only C. Find relevant tutorials for their version or upgrade to Excel 2010 D. Use the student forums for support exclusively Q7. What is one benefit of using data tables as discussed in this video? A. They are necessary for creating macros B. They automatically copy formulas and ensure consistent data entry C. They eliminate the need to use charts D. They provide password security for worksheets Q8. Which lesson covers adding a chart to a Microsoft Word document? A. Lesson 1 B. Lesson 3 C. Lesson 4 D. Lesson 5 Q9. According to the video, what should students do before trying to apply concepts to their own projects? A. Memorize all commands B. Build the sample spreadsheet shown in the video step by step C. Read the entire Excel manual D. Watch only advanced portions of the video Q10. Into how many series or levels are the instructor's Excel courses divided? A. Three: Beginner, Advanced, Developer B. Four: Beginner, Expert, Advanced, Developer C. Five: Introduction, Intermediate, Expert, Advanced, Developer D. Two: Beginner and Developer Q11. Which of the following is NOT listed as a chart formatting skill covered in the video? A. Changing axes B. Adding legends C. Editing formulas directly in charts D. Changing colors Q12. Which topic is specifically mentioned as part of the lessons for displaying multiple charts in a single view? A. Filtering and sorting B. Creating a summary sheet or dashboard C. Importing from Access D. Copying charts to PowerPoint Q13. If a student has questions about a lesson, what is the recommended way to get help? A. Contact Microsoft support directly B. Post questions in the Excel Interactive Student Forums C. Email the instructor D. Wait until the next course level for answers Q14. Which of the following is suggested for students to do FIRST upon watching a lesson? A. Apply it to their real-life projects B. Practice advanced features immediately C. Watch the lesson once completely before trying anything D. Skip the video and read online tutorials only Q15. What type of student is the Excel 2010 Beginner Level 4 course designed for? A. Advanced power users B. People with no Excel experience at all C. Novice users who have completed Levels 1, 2, and 3 D. Visual Basic programmers looking to automate Excel Answers: 1-C; 2-C; 3-B; 4-B; 5-B; 6-C; 7-B; 8-D; 9-B; 10-B; 11-C; 12-B; 13-B; 14-C; 15-C DISCLAIMER: Quiz questions are AI generated. If you find any that are wrong, don't make sense, or aren't related to the video topic at hand, then please post a comment and let me know. Thanks. SummaryToday's video from Excel Learning Zone is Excel 2010 Beginner Level 4. In this course, we will be focusing primarily on charts and working with data tables. You will learn the basics and beyond when it comes to building different types of charts in Excel, such as column charts, pie charts, line charts, and even several 3D chart types. I will show you how to create, manipulate, and reposition charts, as well as how to adjust their properties. We will cover formatting techniques for charts, including changing colors and axes, and learn how to enhance your charts by adding legends, data labels, and data tables. There is a wide variety of customizations and features for charts in Excel that we will explore together.Another key part of this course is learning how to work with data tables. I will guide you on setting up your data in a structured table format, similar to a mini database, which ensures consistent data entry and the automatic copying of formulas. This will help streamline your workflow and make your spreadsheets more efficient. This course is designed specifically for Excel 2010, which is part of Microsoft Office 2010. If you are using Excel 2007, you should be able to follow along easily, as the lessons are very similar. However, if you are using Excel 2003 or an earlier version, I recommend either upgrading to Excel 2010 or using a tutorial specific to your version, all of which are available on my website. Excel 2010 Beginner Level 4 continues right where Beginner Level 3 left off, so if you have not taken that course yet, I highly recommend you do. Level 3 covers essential functions like SUM, AVERAGE, MAX, and MIN, which we will use in our work with data tables. It also introduces styles and themes, both of which will be important for today's lessons on formatting charts and tables. Page layout, inserting illustrations, pictures, and working with clip art are also covered in Level 3 and are important foundations for what we are learning today. My series of courses are structured in four groups: Beginner, Expert, Advanced, and Developer. The Beginner courses are for those just getting started with Excel, designed to introduce you to Excel's basic features and get you working productively with spreadsheets. Once you've completed the Beginner series, you can move up to the Expert level, which offers more in-depth instruction on all the standard Excel features, including tips, shortcuts, and options that go beyond the basics. The Advanced series is intended for power users looking to master macros, user forms, custom templates, and advanced spreadsheet functionality. Finally, the Developer tutorials are focused on teaching you how to program with Visual Basic for Applications in Excel, so you can automate tasks and create custom Excel solutions. Each major group of courses is divided into levels. The Beginner series includes Levels 1, 2, 3, and 4 - this course - and is followed by Level 5. Every level builds on the skills learned in the previous one. Once you are comfortable with all Beginner lessons, you are ready to move on to Expert-level training, followed by Advanced and then Developer courses. Now, let me outline the lessons you will find in this level: Lesson 1 begins with an introduction to charts. Here we discuss the purpose of charts, learn about the various components of a chart, and practice inserting a basic column chart in Excel. Lesson 2 continues our exploration of charts. This lesson covers how to add new data to an existing chart, create a line chart, build charts with multiple data series, and quickly enhance their appearance using Excel's chart styles and themes. In Lesson 3, you'll learn how to create charts from non-contiguous (non-adjacent) data ranges, make a 3D pie chart, move charts to separate sheets, change a chart's layout and type, and design some 3D column charts. Lesson 4 will teach you how to switch the axes of your chart, select and reformat specific elements, insert graphical objects such as pictures, shapes, and text boxes inside charts, and make adjustments to all types of chart labels. Lesson 5 shows you how to incorporate your Excel charts into a Microsoft Word document, which is helpful when you need to present your charts in written reports. We will also make a summary sheet so you can display several charts from different parts of your workbook together on one dashboard, and you will see how to pull out individual slices from a pie chart for emphasis. Lesson 6 is all about tables. You'll find out what tables are, what advantages they offer, and how they differ from regular spreadsheet ranges. We will look at table-specific formulas, filtering and sorting table data, and enabling the total row for instant summary calculations. If any of the material covered today is unclear or you run into any problems, you are encouraged to ask questions in the Excel Interactive Student Forums. If you are watching this course through my website or custom video player, you should see a forum window next to each lesson, showing all student questions and answers related to that topic. Reading these discussions can be very helpful, and you are welcome to contribute your own questions and comments as you progress through the course. If you're accessing the course offline, you can always visit the forums later at ExcelLearningZone.com. For best results, I recommend that you watch each lesson all the way through once before trying to copy it yourself. After watching, replay the lesson while following along step by step, building your own spreadsheet to match the examples. Make sure you can complete the exercises before attempting to apply the concepts to your own projects. If you find yourself stuck or confused, simply rewatch the video from the beginning or post your questions to the forums so I can assist you. Remember, Excel may seem overwhelming at first, but as you spend more time with it, you will discover that it is actually quite straightforward and user-friendly. For a complete video tutorial with step-by-step instructions on everything discussed here, visit my website at the link below. Live long and prosper, my friends. Topic ListInserting column chartsUnderstanding parts of a chart Adding data to an existing chart Creating line charts Working with multiple series in charts Using chart styles and themes Charting non-contiguous data Creating 3D pie charts Moving charts to different sheets Changing chart layout and chart type Creating 3D column charts Switching row and column axes in charts Selecting and formatting chart elements Inserting pictures, shapes, and text boxes in charts Adjusting chart labels Inserting Excel charts into Word documents Building a summary sheet with multiple charts Separating a pie slice in pie charts Understanding Excel tables Benefits of using tables Inserting table formulas Filtering and sorting table data Turning on the total row in tables Primary Topicscharts, chart types, chart formatting, chart data, data tables, table formulas, sorting, filtering, integrating charts with WordSecondary Topicsstyles, themes, working with non-contiguous data, axes management, dashboard summary sheets, object insertion in charts |
||
|
| |||
| Keywords: Excel charts, Excel tables, column chart, line chart, pie chart, 3D chart, chart formatting, chart styles, chart themes, insert chart in Word, dashboard, chart labels, chart legends, switch axes, table formulas, sort filter Excel, table total row PermaLink How To Create And Format Charts And Tables With Data Visualization Tools in Microsoft Excel 2010 |