Free Lessons
Courses
Seminars
TechHelp
Fast Tips
Templates
Topic Index
Forum
ABCD
 
Home   Courses   TechHelp   Help   Contact   Merch   Join   Order   Logon   Forums   
 
Back to Access Forum    Comments List
Upload Images   @Reply   Bookmark    Link   Email   Next Unseen 
Graphical Reports in Access
Patrick McCabe 
    
4 years ago
Hello all,
I am new to Access and so far I am only through Beginner 5, but moving quickly through!

My question is a more general Access question than a specific how-to question. Once I have moved through the curriculum more, I am planning to start a database tracking interventions that our healthcare team has made for patients over time. I will certainly post more questions as I am working on it, but before I begin I'd like to ask the group: How good is Access with graphical representation of data?

I have several spreadsheets in Excel and all of the "deliverables" are charts/graphs.  From what I have seen of Access so far, it seems to be great for more "written" type reports great for businesses (invoices, mailing labels, etc) but nothing with a graph. I have looking ahead and see one class on charts at the end of the expert level. I'm wondering if-with all the lessons on Access and only 1 is dedicated to graphical representation of data- I should stick with Excel.

For anyone wondering, the reason why I am looking to use Access, when I already have some robust stuff in Excel, is because I believe a database will be much easier to store the data in one place. I plan to create a "patient" table with buttons to "add new visit," "Add new intervention," etc. Rather than what I am doing now with a separate spreadsheet for everything!

Sorry for the novel. Thanks for your input.
Kevin Robertson  @Reply  
          
4 years ago
Here is a couple of Tech Helps on Charts.

Dashboards
Percent of Total in Charts
Scott Axton  @Reply  
      
4 years ago
Strictly my personal opinion here - so take it with a grain of salt.

I'm a data guy and 99.999% of my dealings consist of working with the data - not the output.
For me the written reports have been adequate.

That being said, if I needed more than basic graphing, Excel probably has the edge.  What I recommend is combining the two.

Let access manage your data and give you the control you need to interact with your users.
Then you can output your data in a way that you can work with the results to do you graphing and charts in Excel.

Those are pretty intensive topics so you are on the right path continuing the courses at this time. By the time you get into the Developer levels you will get into interacting with the other MS Office products.

Hope that helps.
Patrick McCabe OP  @Reply  
    
4 years ago
Thank you for your quick replies Kevin and Scott, I found them helpful! It was just important to me to understand that some of those more complex utilities exist even though I'm not there yet!

I'd be interested in a Seminar geared toward databases used for research. In healthcare we often use RedCap, but not everyone is provided access by the health system. Not sure how big the audience would be I guess, but I would think Access would be able to provide some robust analysis for folks that know how to use it!

Thanks again!
Scott Axton  @Reply  
      
4 years ago
Patrick
One nice thing about Access is that you the developer can provide the analysis tools for the user with out them having to know a great deal of "how it works".
A little training how to use your database and they can pull the reports and data - provided you have built it - that they need.

Job security for you too!  LOL
Richard Rost  @Reply  
          
4 years ago
Access is definitely the much better tool at storing data, working with data, building a user interface, etc. It has rudimentary charting capabilities, but Excel's are more robust. My opinion is to keep all of your data in Access and then when you need a fancy chart, export what you need to Excel and chart there.

Never heard of RedCap. Is it this?
Patrick McCabe OP  @Reply  
    
4 years ago
Thanks Richard!

That's the one!

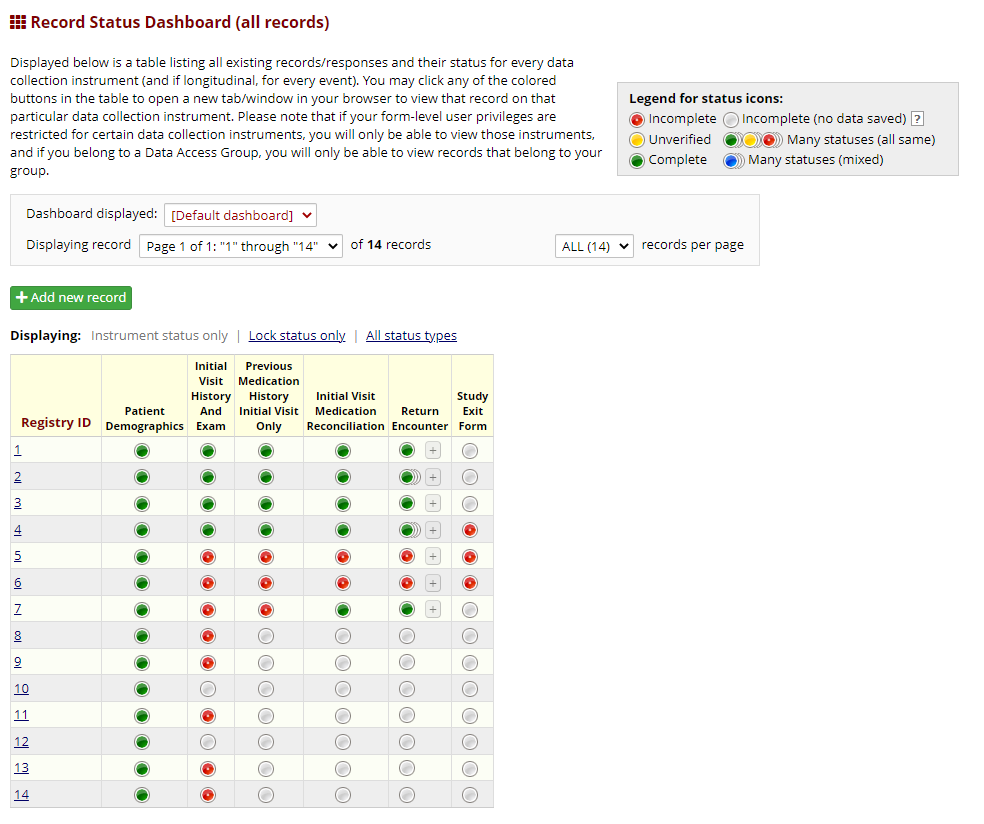
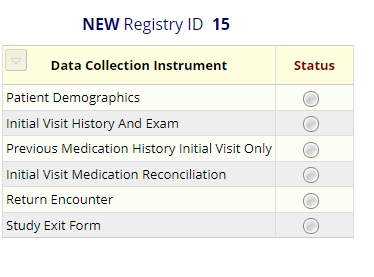
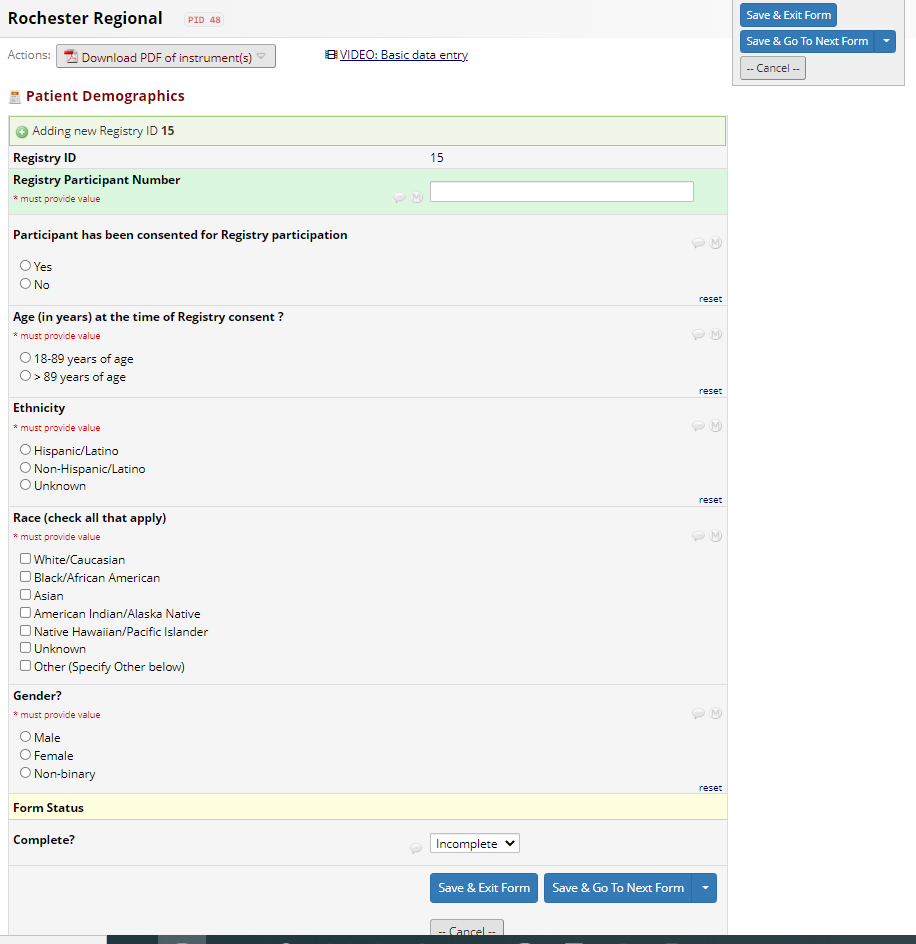
I have limited experience with REDCap myself. I don't have access to build a project from the ground up, just doing data entry for other research projects. I'll share some screenshots of the data entry if you're curious. However it the the project managers who can actually pull reports, etc so I'm not sure about how those look!
Patrick McCabe OP  @Reply  
    
4 years ago

Patrick McCabe OP  @Reply  
    
4 years ago

Patrick McCabe OP  @Reply  
    
4 years ago

Patrick McCabe OP  @Reply  
    
4 years ago
And so on... All Data entry. Don't have access to what the data tables reports look like.

Thanks again for you input!
Allan McConnell  @Reply  
     
4 years ago
It appears that your data that is being collected are all Yes/No check boxes, which includes all the data that is being collected on the front of the sheet in each block?
It also appears that there is a color selection in the first form that sets the answer required for the column, which as a user I am slight color blind and would send me nuts.
The information would be handled very well in Access and if I were a user, I would find the Access database far easier to use.
You have a lot more control in Access and can be exported back to Excel to perform your charts etc.
Keep up with the courses. I have using Access for a number of years and am doing the course as well to pick up on new stuff and all the stuff I have done wrong over the years. Good luck with your development and say you are on the right track.
Richard Rost  @Reply  
          
4 years ago
Agreed. None of that stuff looks terribly difficult once you're up to speed with Access.

This thread is now CLOSED. If you wish to comment, start a NEW discussion in Access Forum.
 

Next Unseen

 
New Feature: Comment Live View


The following is a paid advertisement
Computer Learning Zone is not responsible for any content shown or offers made by these ads.
 

Learn
 
Access - index
Excel - index
Word - index
Windows - index
PowerPoint - index
Photoshop - index
Visual Basic - index
ASP - index
Seminars
More...
Customers
 
Login
My Account
My Courses
Lost Password
Memberships
Student Databases
Change Email
Info
 
Latest News
New Releases
User Forums
Topic Glossary
Tips & Tricks
Search The Site
Code Vault
Collapse Menus
Help
 
Customer Support
Web Site Tour
FAQs
TechHelp
Consulting Services
About
 
Background
Testimonials
Jobs
Affiliate Program
Richard Rost
Free Lessons
Mailing List
PCResale.NET
Order
 
Video Tutorials
Handbooks
Memberships
Learning Connection
Idiot's Guide to Excel
Volume Discounts
Payment Info
Shipping
Terms of Sale
Contact
 
Contact Info
Support Policy
Mailing Address
Phone Number
Fax Number
Course Survey
Email Richard
[email protected]
Blog RSS Feed    YouTube Channel

LinkedIn
Copyright 2026 by Computer Learning Zone, Amicron, and Richard Rost. All Rights Reserved. Current Time: 8/8/2026 2:10:15 AM. PLT: 1s