Free Lessons
Courses
Seminars
TechHelp
Fast Tips
Templates
Topic Index
Forum
ABCD
 
Home   Courses   TechHelp   Help   Contact   Merch   Join   Order   Logon   Forums   
 
Back to Access Developers    Comments List
Upload Images | @Reply | Bookmark | Link | Email | Next Unseen |
Help with Reports Layout and Functionality
Debbie Heaney 
     
15 hours ago
I think i pressed a wrong button early and didn't actually post this?
Can i do it right this time?

I can do with some help with building a report.
Not being good at just using words, and this needing a few screenshots, I've put it into a video that will hopefully be enough as explain what I currently have versus what I would like.
Richard Rost  @Reply  
          
14 hours ago
Hi Debbie. Your post came through. I understand that showing the problem can be easier than describing it, and we do want to help. For this question and future posts, though, please upload screenshots here rather than linking to a video. Screenshots let everyone see what's going on at a glance. Watching a separate video takes extra time that many of the people helping here don't have.

I also generally don't allow external links because we've had people post inappropriate material in the past. That's a general forum rule, not a criticism of your video. A few screenshots showing what your report looks like now and what you'd like to change, with a short note under each, would be a good way to continue.
Debbie Heaney OP  @Reply  
     
14 hours ago
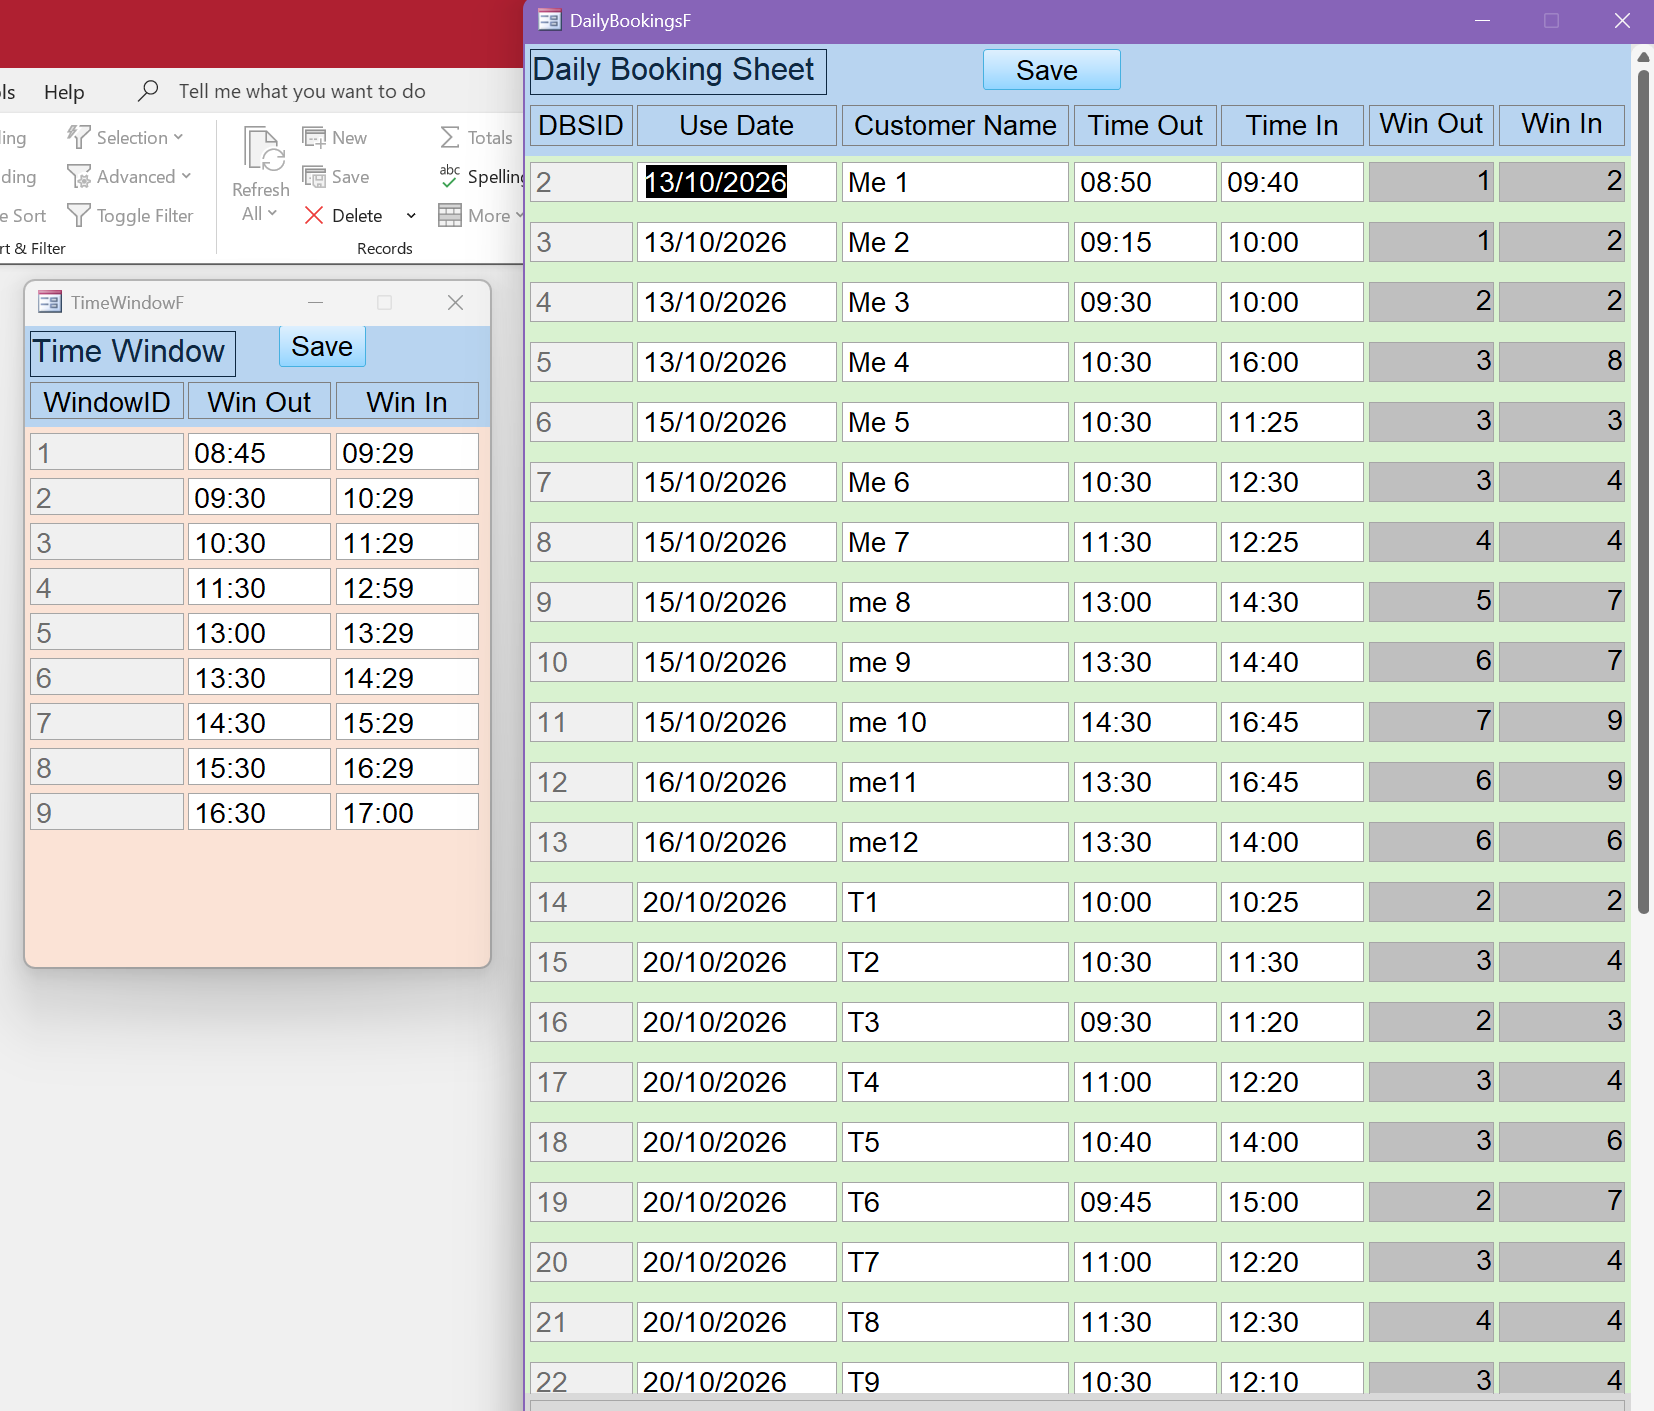
Starting with the data input side of things. The "Daily Booking Sheet" section is the main form, an After Update event for both Time Out and Time In runs a DLookup to get what I am calling the "Time Window". A period of time within which the customer came in/out.
Debbie Heaney OP  @Reply  
     
14 hours ago

Debbie Heaney OP  @Reply  
     
14 hours ago
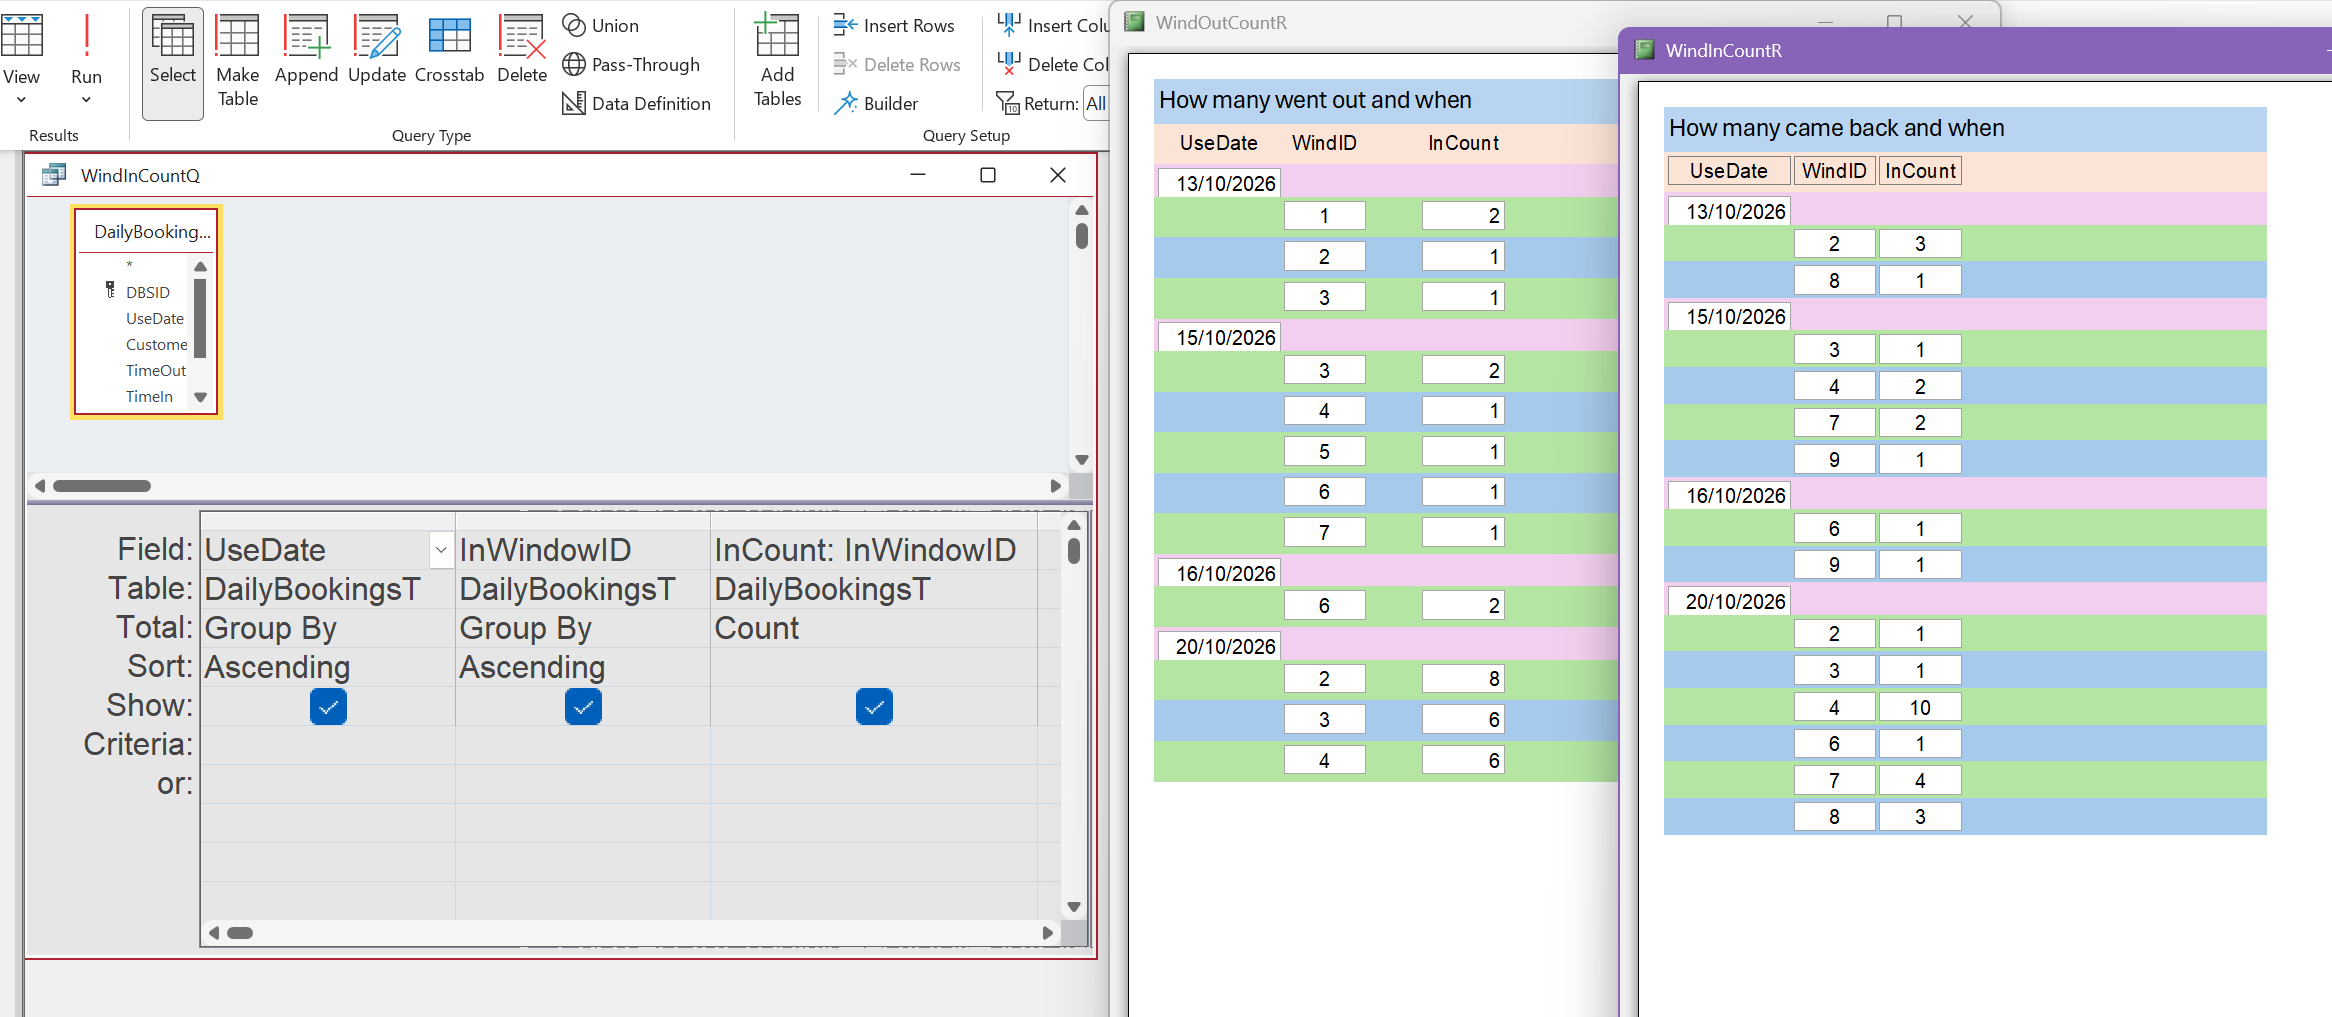
From this data I would then like to  create a report to summarize and count up how many customers came and went with a time window.
I have two basic reports that do the job. Whilst these would be enough if it was just me using them it's not very user friendly for others to use. Once this is integrated into the main project it will be used by 8 others with varying degrees of confidence in using computers.
(Doing this a standalone for now so as not to risk the main project)
Debbie Heaney OP  @Reply  
     
14 hours ago

Debbie Heaney OP  @Reply  
     
14 hours ago
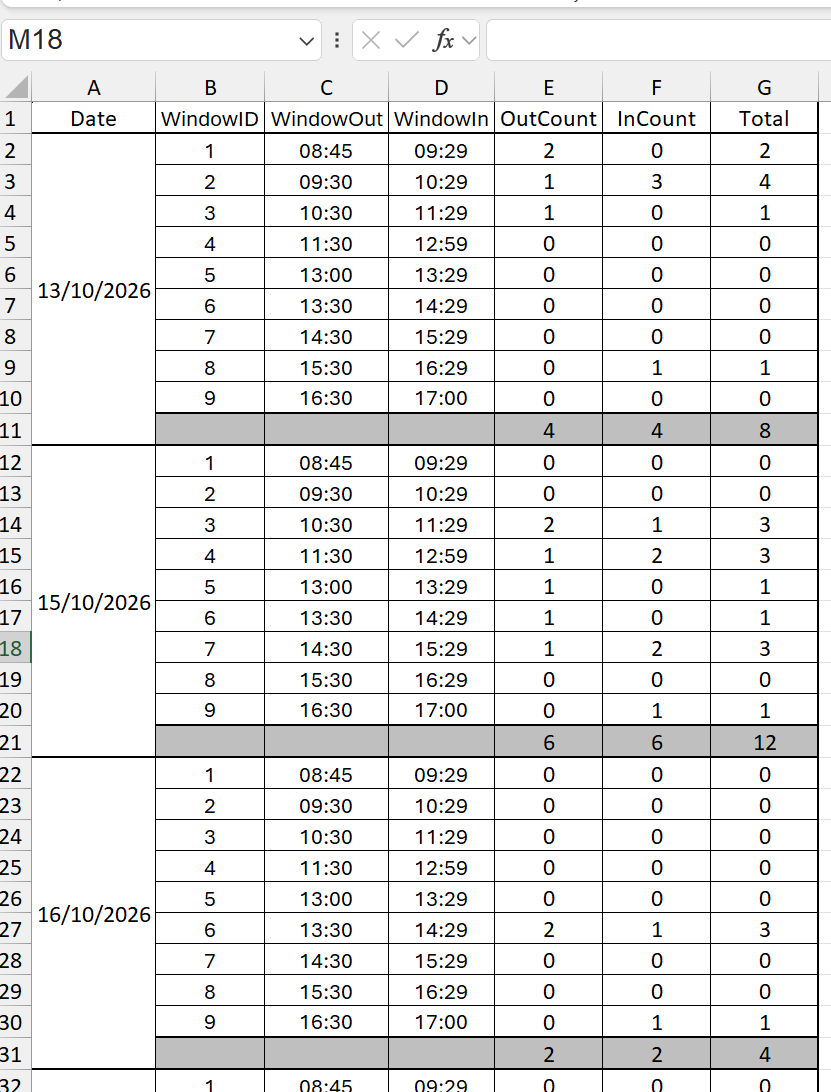
What I would like is a report that looks something like this spreadsheet.
Grouped by date, listing all the time window, next to that the count of customers going out, customers coming back back and the total for that time window.
Ignore the grayed out lines, those are there purely for me and checking the numbers all match up, this is not needed in the real thing.
Debbie Heaney OP  @Reply  
     
14 hours ago

Debbie Heaney OP  @Reply  
     
14 hours ago
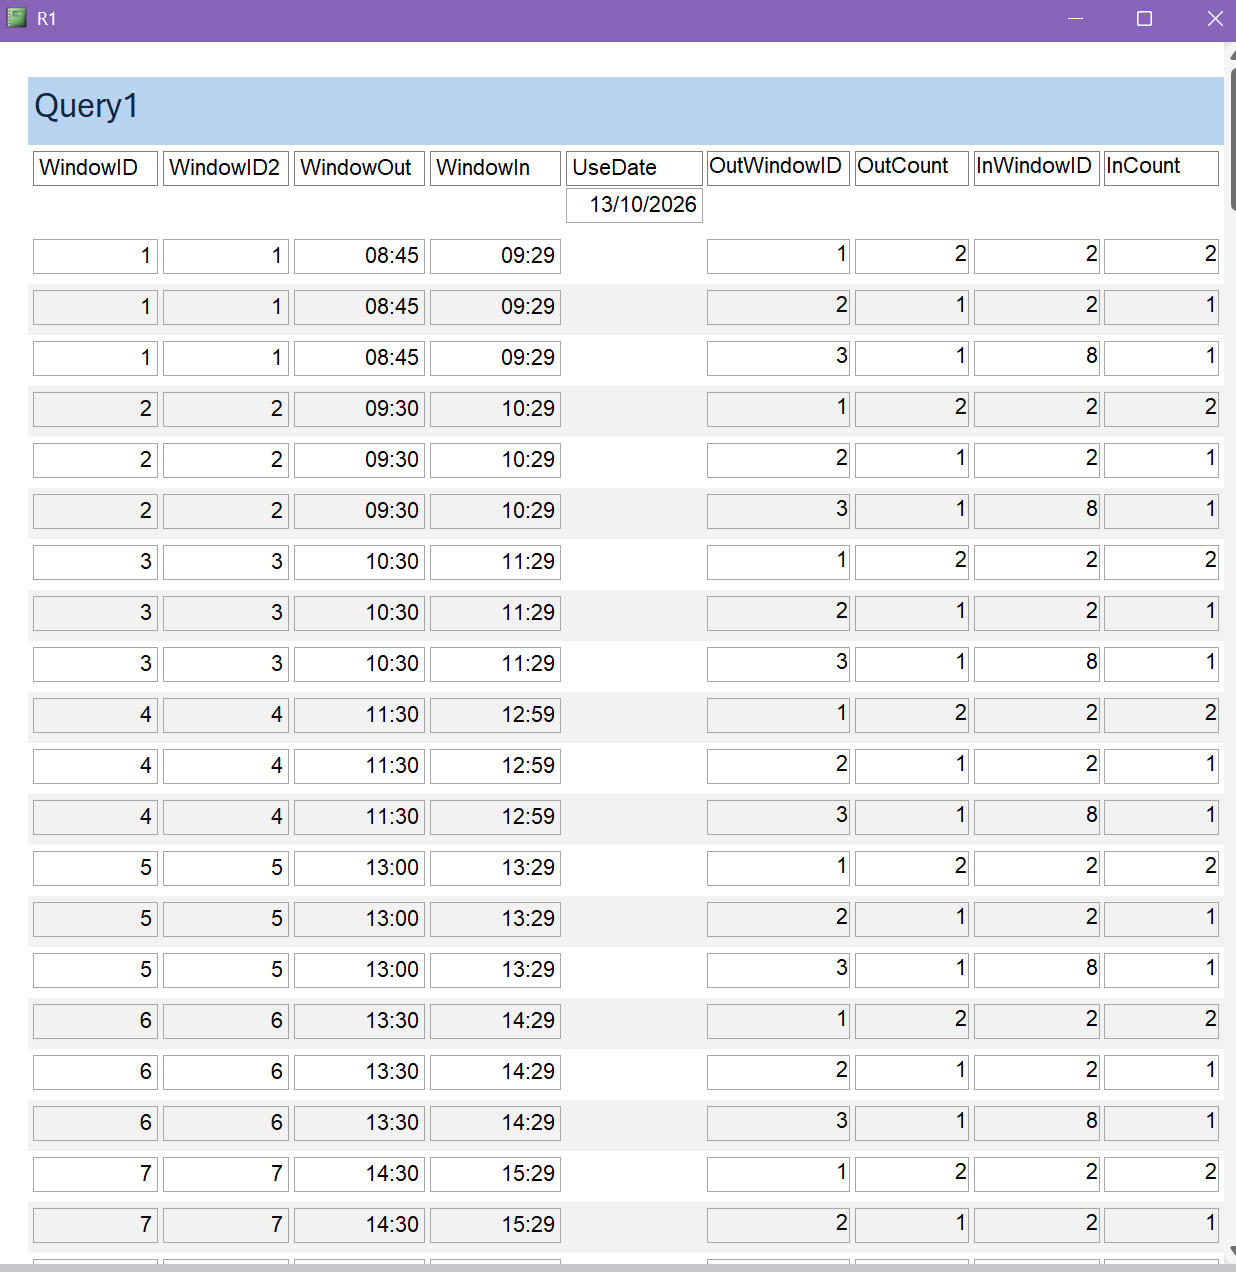
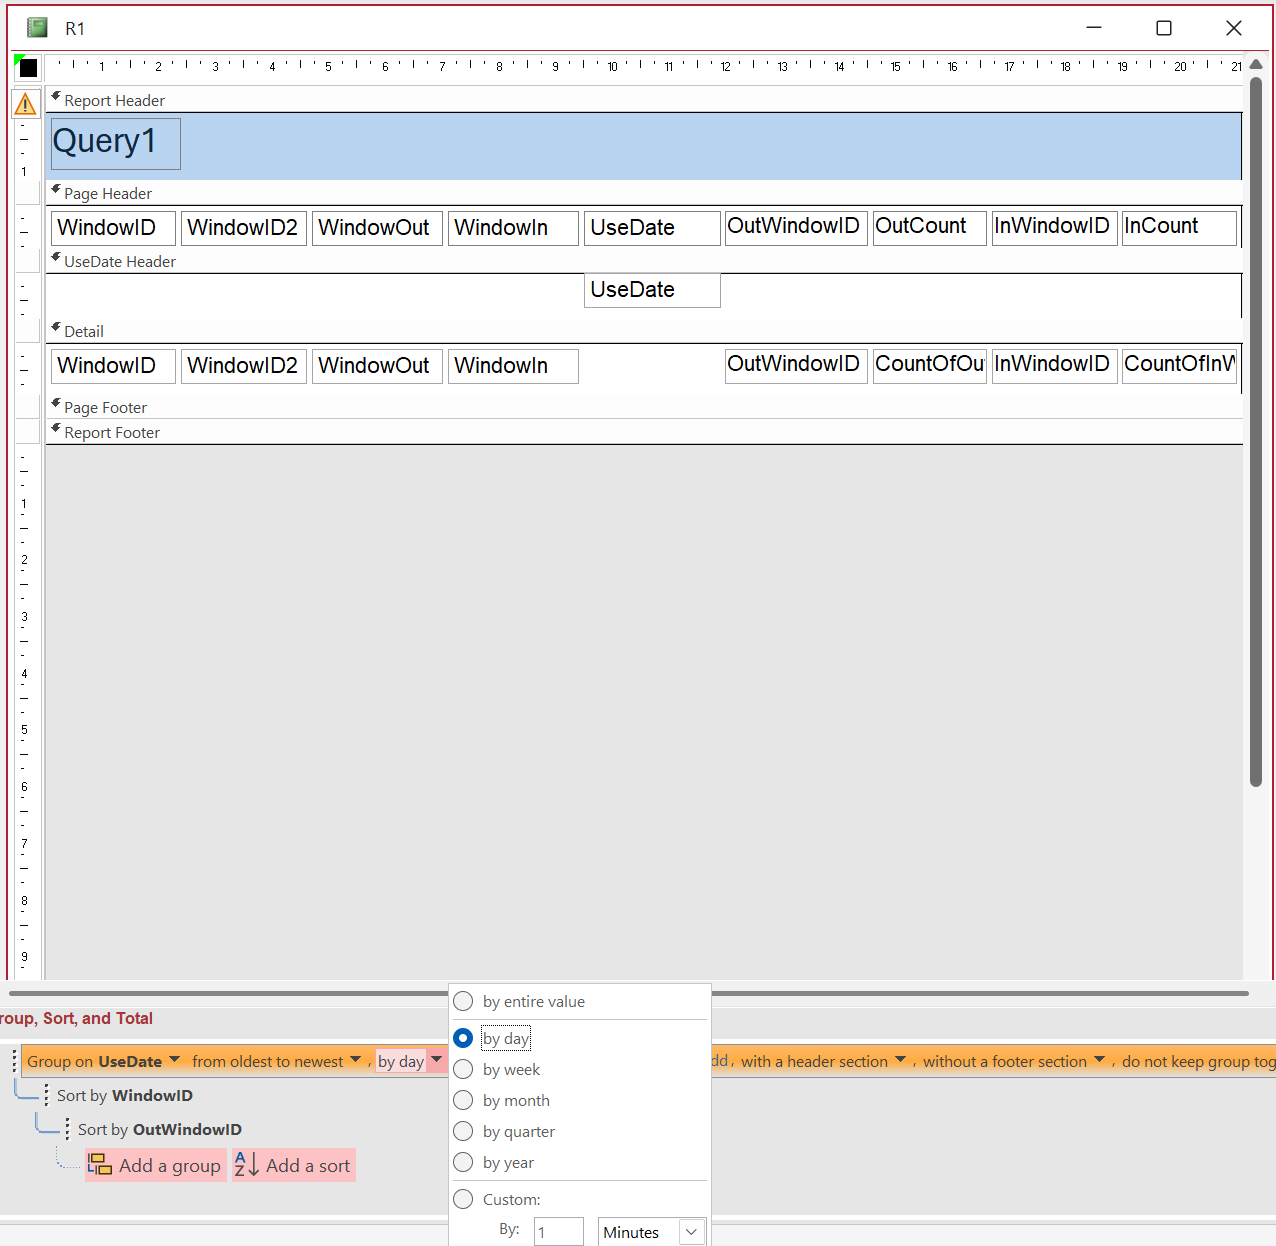
The part I am having difficulty with is trying to make a report that looks like the spreadsheets.
No matter what I try it turns out a mess of numbers. Making sense of this jumble is possible but it take work.
each time window is listed 3 times.
Debbie Heaney OP  @Reply  
     
14 hours ago

Debbie Heaney OP  @Reply  
     
14 hours ago

Debbie Heaney OP  @Reply  
     
14 hours ago
The Report settings above. A nice option to have would be the ability to change the report grouping based on user input.
Debbie Heaney OP  @Reply  
     
13 hours ago
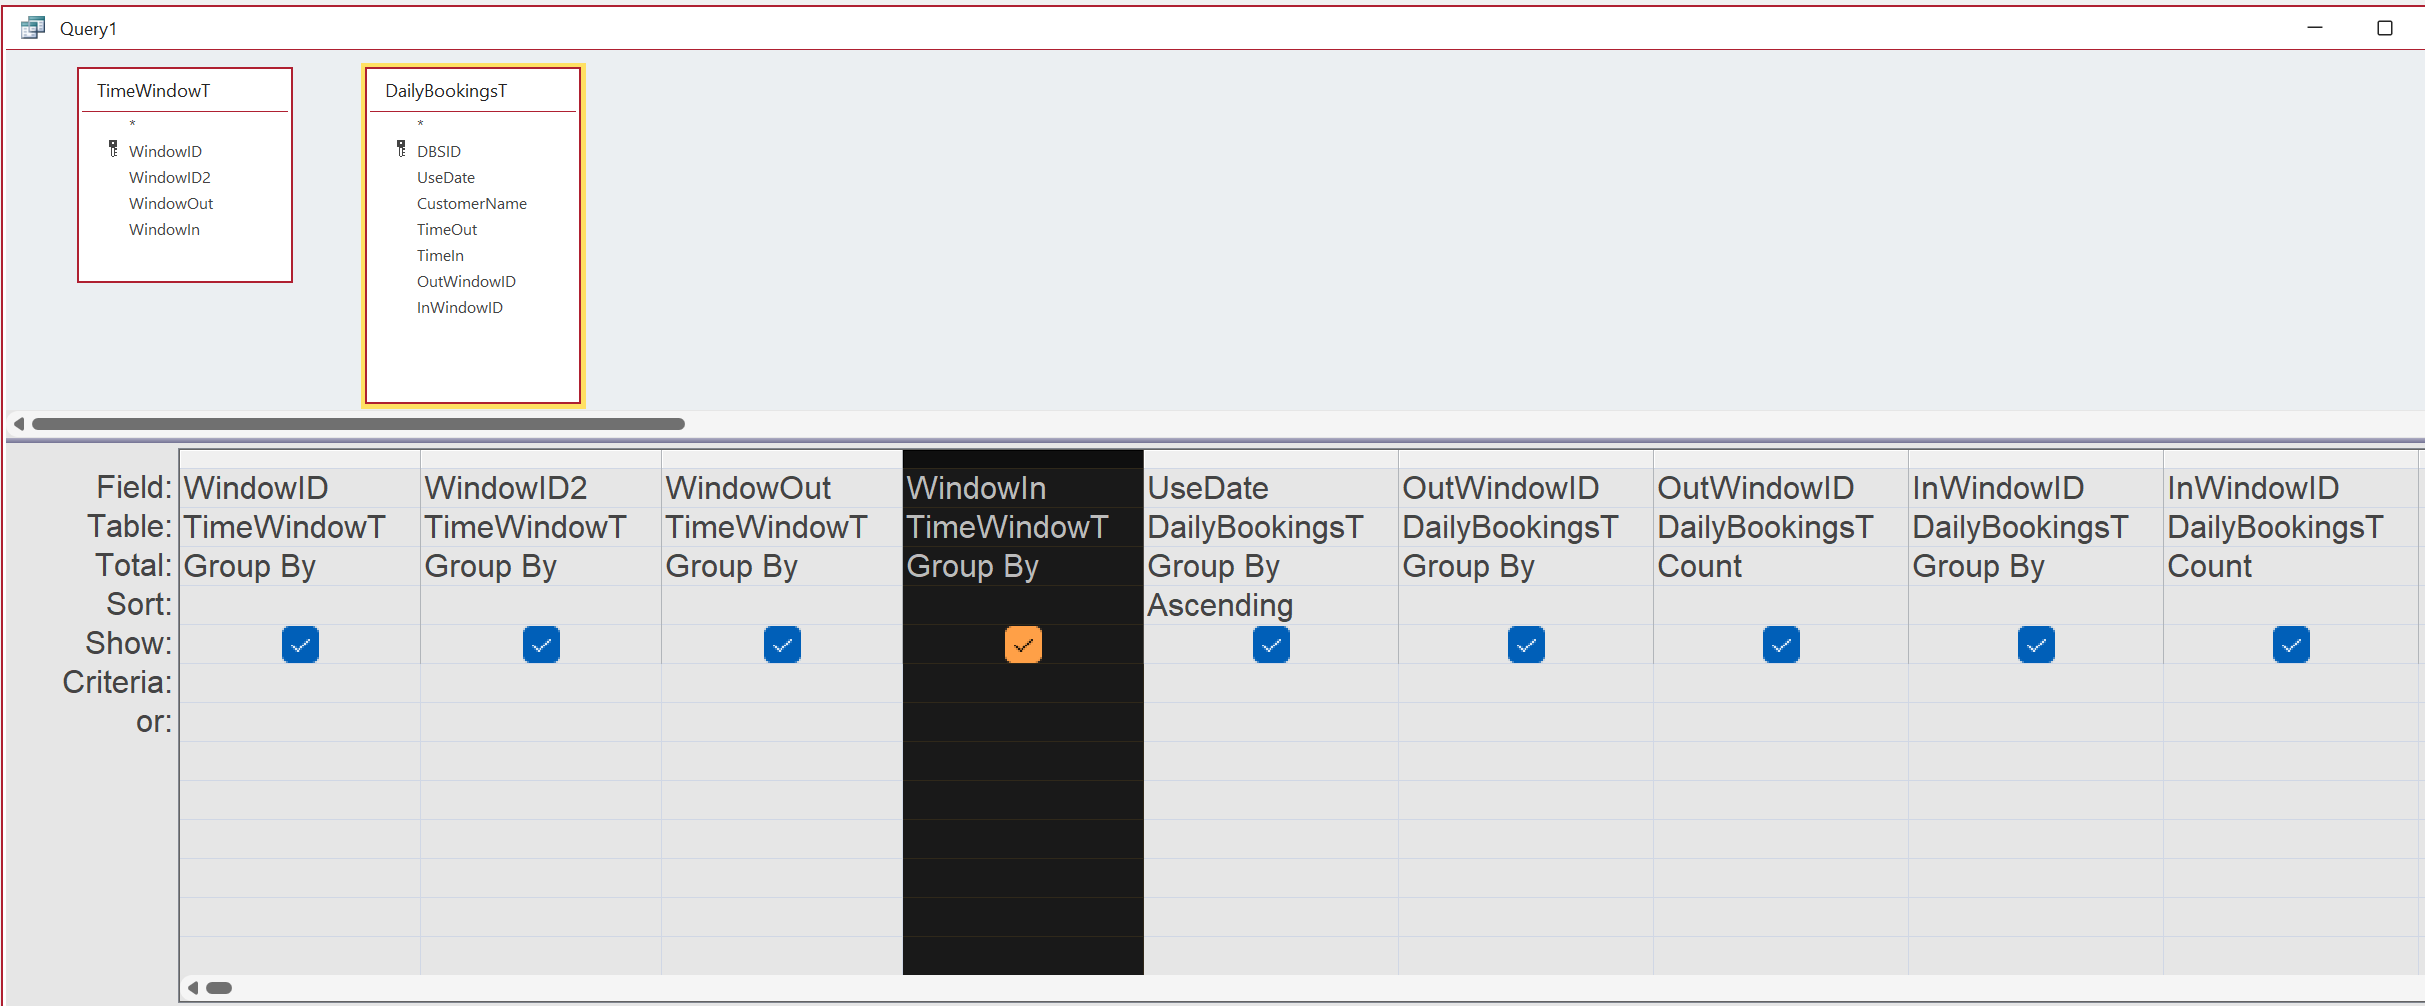
Then the query behind that. I've tried different relationships and join types. different fields selected, different ordering of the fields, so many other things I've lost track. I just can't get it to the point of being usable by others.
Debbie Heaney OP  @Reply  
     
13 hours ago

Debbie Heaney OP  @Reply  
     
13 hours ago
I think that's all the main point of interest?
John Davy  @Reply  
         
13 hours ago
Hi Debbie, Just so I understand = Can you tell me what is WindowOut and WindowIn and why WindowOut is earlier than WindowIn? And explain WindowIn and WindowOut. I am just trying to understand. Thanks John
Debbie Heaney OP  @Reply  
     
13 hours ago
I am part of a small charity that hires out mobility equipment for the day.
We keep track of when people come in to start a hire (Time Out) and when they return the equipment to end the hire (Time In)

The "WindowOut" is the the time they started the hire. A customer arriving at 9:15 to start the hire is doing so within "WindowOut=1". They started the hire sometime between 8:45am and 9:29 am.
Then at the end of their time out the return with a window of time. returning at 10:00 is withing "WindowIn=2". They returned some time between 9:30 am and 10:29am.
Richard Rost  @Reply  
          
12 hours ago
Thanks for the screenshots, Debbie. They make the problem much clearer. I'd get the query right before changing the report layout.

Your last screenshot shows no join between TimeWindowT and DailyBookingsT. That combines each time window with every booking. You're also grouping by both OutWindowID and InWindowID, which produces separate rows for different out/in combinations rather than one row per time window.

Keep your two separate count queries. Each should return one row per date and window: one counts departures, the other counts returns. To include the zero rows shown in your spreadsheet, first make a list of each reporting date paired with all nine time windows. Then use outer joins from that list to the two count queries, matching BOTH the date and window ID. Missing counts can become zero with Nz, and Total is OutCount plus InCount. My Outer Joins video explains keeping rows that have no matching records.

Once that query shows one row per date/window, use it as the report's Record Source, group by UseDate, and sort by WindowID. I'd leave user-selectable grouping until those counts match your spreadsheet. Also, that Total counts movements, not distinct customers: someone leaving and returning in the same window contributes two.
Add a Reply Upload an Image
Next Unseen


What's This?


The following is a paid advertisement
Computer Learning Zone is not responsible for any content shown or offers made by these ads.
 

Learn
 
Access - index
Excel - index
Word - index
Windows - index
PowerPoint - index
Photoshop - index
Visual Basic - index
ASP - index
Seminars
More...
Customers
 
Login
My Account
My Courses
Lost Password
Memberships
Student Databases
Change Email
Info
 
Latest News
New Releases
User Forums
Topic Glossary
Tips & Tricks
Search The Site
Code Vault
Collapse Menus
Help
 
Customer Support
Web Site Tour
FAQs
TechHelp
Consulting Services
About
 
Background
Testimonials
Jobs
Affiliate Program
Richard Rost
Free Lessons
Mailing List
PCResale.NET
Order
 
Video Tutorials
Handbooks
Memberships
Learning Connection
Idiot's Guide to Excel
Volume Discounts
Payment Info
Shipping
Terms of Sale
Contact
 
Contact Info
Support Policy
Mailing Address
Phone Number
Fax Number
Course Survey
Email Richard
[email protected]
Blog RSS Feed    YouTube Channel

LinkedIn
Copyright 2026 by Computer Learning Zone, Amicron, and Richard Rost. All Rights Reserved. Current Time: 11/2/2026 4:40:32 AM. PLT: 1s