|
|
Free Lessons Courses Seminars |
TechHelp Fast Tips Templates |
Topic Index Forum ABCD |
|
||||||
|
Access Expert 31 Bar Charts, Pie Charts, 3D Charts, Dashboards Welcome to Access Expert 31. In this course you will learn how to create and format bar charts, pie charts, and 3D chart options within Microsoft Access, as well as how to build a dashboard form to display multiple charts from your data. We will discuss key chart components, recommended prior courses, and accessing the sample database, and you will see how these lessons fit into the overall curriculum. We will also explain how to get help through the support forums if you need assistance. Lessons
Resources
Lesson SummaryWelcome! Bar & Pie Charts, Dashboards - Welcome to Microsoft Access Expert Level 31. In this course we will focus on charting in Microsoft Access, including how to create bar charts, pie charts, and 3D chart options, as well as tips for formatting and building a dashboard form to display multiple charts with your data. We will discuss prerequisites, recommended prior courses, explain how these lessons fit into the overall curriculum, and review how to access the sample database and seek help in the support forums if needed. The class is suitable for all Access versions from 2007 to 2016.
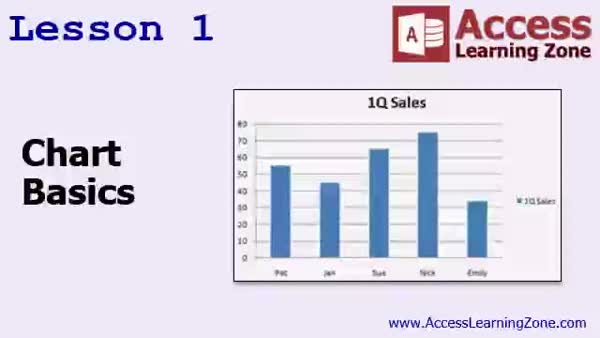
Lesson 1: Chart Basics & Simple Creation - In Lesson 1, we will learn what a chart is, why charts are useful, and the different parts of a chart. We will discuss how charts provide visual representations of data, making it easier to spot trends and compare information. We will examine key components such as the chart area, data series, data points, axes, titles, legends, and gridlines. I will show you how to set up a simple sales table in Access and walk through the steps to add a basic chart to a form using the chart wizard. Different chart types and their uses are also introduced.
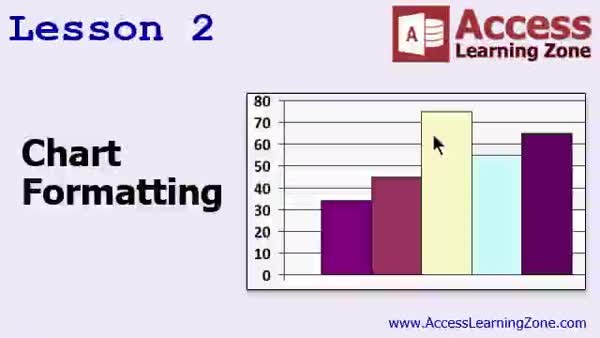
Lesson 2: Format Charts: Titles & Colors - In Lesson 2, we will explore different chart formatting techniques, including how to preview, edit, and format charts in Access. I will show you how to adjust chart titles, legends, grid lines, series colors, and the overall appearance, as well as how to address common issues like distortion using the property sheet and chart editor. We will also discuss options such as stretch, clip, and zoom for resizing, and touch on some of the limitations and bugs present in Access charts. This lesson will help you improve the look and functionality of your charts.
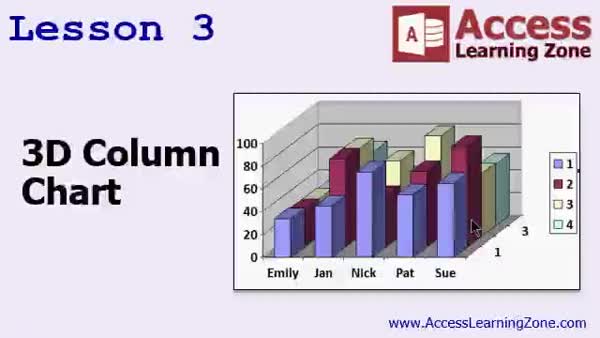
Lesson 3: 3D Column Charts: Multi-Series - In Lesson 3 we continue working with chart formatting by exploring how to create and customize 3D Column Charts in Access. I will show you how to adjust chart and form backgrounds, use the back style property, add multiple data series to your chart, and modify chart data layouts. We will walk through creating both standard and 3D column charts, discuss how different data structures affect chart creation, and look at formatting options like resizing, changing colors, and applying 3D effects to your charts.
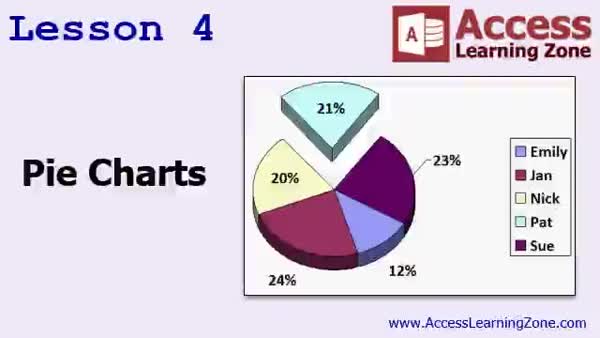
Lesson 4: Pie, Column Charts & Trendlines - In Lesson 4, we will walk through various ways to create and customize pie charts in Access, including exploring 3D view options, formatting chart elements, resizing labels, and working with chart data series and colors. We will also discuss adding data labels, adjusting gap width and depth, and using trendlines like linear and moving average in column charts. Additionally, I will show you how to isolate pie slices, position data labels, and explain the impact of changing data. Finally, we will compare Access charting features briefly to those available in Excel.
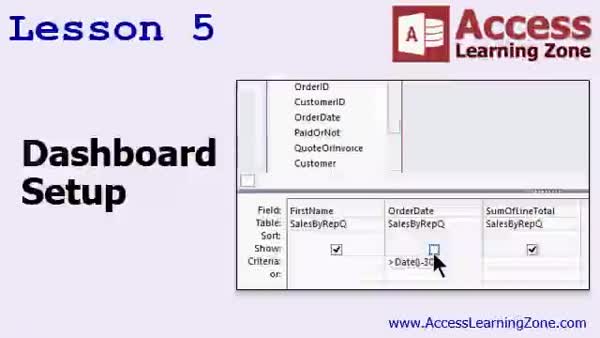
Lesson 5: Sales Rep Dashboard With Charts - In Lesson 5, we return to the PC resale database and begin building a dashboard to display multiple charts on a single form. We will review the existing database setup, focusing on employees, orders, and related queries. I will show you how to prepare real sales data by updating order dates while adhering to validation rules, and how to build a query showing sales by sales rep for the last 30 days. We will also discuss how to handle query aggregation to ensure the chart summarizes data correctly for our dashboard in this part of the Charts 5 series.
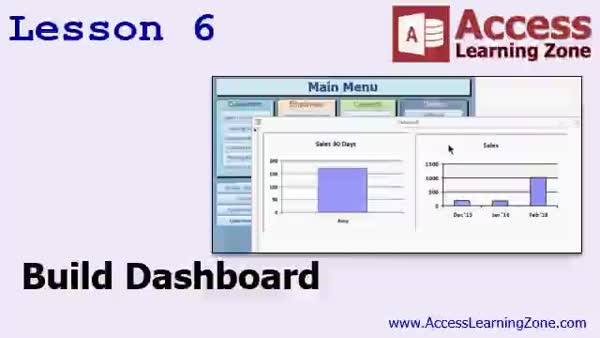
Lesson 6: Interactive Sales Dashboards - In this lesson, we will continue building the dashboard started in the previous lesson by adding charts to a dashboard form in Access. I will show you how to create a dashboard form, add multiple chart types based on queries, and set up a button on your main menu to quickly access your dashboard. We will walk through including data checks for paid orders and invoices in your queries, discuss how to add trend lines or group sales data by date, and see how to incorporate these charts into reports as well. This lesson demonstrates essential steps for working with charts in Access.
Lesson 7: Chart Basics, Formatting & Dashboards - In this course we learned the basics of working with charts, including what charts are, why they are useful, the components of a chart, and fundamental formatting such as editing titles, formatting data series, and adjusting chart colors. We also covered creating transparent backgrounds, working with 3D column charts, formatting chart walls and floors, using pie charts, and adding trend lines. The course guided us through setting up a PC resale database to track sales reps and queries, and assembling a dashboard form to view key business information. We also discussed options for getting help and providing feedback.
NavigationKeywordsbar charts, pie charts, dashboards, chart formatting, 3D column charts, chart wizard, trendlines, sales dashboard, data series, chart properties, form charts, chart backgrounds, data labels, sales by rep, transparent backgrounds, chart aggregation
IntroIn this lesson, we will learn how to create and work with charts in Microsoft Access, including building bar and pie charts and exploring 3D formatting options. We'll also talk about setting up a dashboard to display multiple charts on one form using example data from the PC resale database. This class covers the basics of charting in Access, how charts differ from those in Microsoft Excel, and provides step-by-step guidance for formatting and displaying your data visually. This is Lesson 31 in the Access Expert series.TranscriptWelcome to Microsoft Access Expert Level 31, brought to you by AccessLearningZone.com. I'm instructor Richard Rost. Today's class is all about charting in Microsoft Access.You might have done some charting in Excel, where you can build charts right into your Access database to make it so that you can click one button and then automatically see all the information that you want to see. We'll build a couple of different types of charts. We'll do some sales charts. We'll build some bar charts and some pie charts. We'll talk about 3D options in formatting. Then we'll build a dashboard toward the end of class where you can see all the relevant information from your database on one big form with lots of different charts on it. Before taking this class, I strongly recommend you take Access Expert Level 30 and all the classes before that. We will be building some stuff in our PC resale database, so it would be helpful if you've built that database yourself and understand how it is put together. It would also be helpful, but not required, if you have taken my Excel Beginner Level 4 class. That's where I cover how to do charts in Excel. Sometimes it's easier to learn things in Excel first. Then, when you try to do them in Access, it makes much more sense. Building tables is easier if you understand how a spreadsheet is put together. Charting in Excel is actually really easy. There is a tiny bit of a learning curve to move over to Access, but not much. If you know the Excel stuff first, then all the stuff in today's class will seem very simple. This class was recorded using Access 2016. Yes, this is the first class that I have recorded since upgrading my machines from Office 2013 to Office 2016. There is not much that is different. You can use this class with every version of Access all the way back to 2007. So whether you have 2007, 2010, 2013, or 2016, everything in today's class will be pretty much exactly the same. If you do come across any differences, please let me know. I will be putting together a separate class to go over the few minor differences and little upgrades they put in from 2013 to 2016. For today's class, you do not need to worry about those. Now let's take a look at the topics that we're going to cover in today's class. In lesson one, we're going to learn what a chart is. We're going to learn why charts are useful, and we'll learn about the different parts of a chart. In lesson two, we're going to learn about different types of chart formatting techniques. In lesson three, we'll continue with chart formatting and learn about 3D column charts. Lesson four covers everyone's favorite charting topic, pie charts. In lesson five, we're going to go back to our old PC resale database and start setting up a dashboard where we can see lots of different charts on one big form. In lesson six, we'll continue building the dashboard that we started in lesson five. For those of you who are new to my courses, they are broken up into four different series: Beginner, Expert, Advanced, and Developer. Each series is made up of multiple levels. Expert, for example, has, as of right now, 31 levels. This is Expert Level 31. Beginner had nine different levels. My courses are designed to be followed one after the other, so you should take Level 1, then Level 2, then Level 3, all the Beginner classes, then the Expert classes, and soon we'll have the Advanced and Developer series. In addition to my normal Access classes, I also have lots of different seminars designed to teach specific topics. My seminars include web-based databases, creating forms and reports that look like calendars, securing your database, working with images and attachments, writing work orders, running a service business, tracking accounts payable, learning the SQL programming language, creating loan amortization schedules, and lots more. You can find details on all of these seminars and more on my website at AccessLearningZone.com. If you need help, there are forums on my website where you can post your questions. You can find that at AccessLearningZone.com/forums. We do not guarantee support, but we do our best to try and help you with questions if you post them in the forums. We will be using a sample database in today's class. AccessLearningZone.com/databases is where you can download the sample database that I'll be using later on in today's class. You will need your password for this class, which you can get on your account on the website. Now sit back and relax. Watch the video as many times as you want and follow along with me. Build the database yourself if you can. Rewatch the video if you have to and, of course, keep an open mind. Anyone can do this. Access is not hard. Thanks for watching. QuizQ1. What is the main topic covered in Microsoft Access Expert Level 31?A. Importing data into Access B. Charting in Microsoft Access C. Query design in Access D. VBA programming in Access Q2. Why does the instructor suggest taking Expert Level 30 and previous classes before this one? A. Because they cover VBA programming needed for this course B. Because they include all the chart templates needed C. Because they build foundational knowledge and the PC resale database used in this class D. Because they offer discounts for subsequent courses Q3. What types of charts will be created in this course? A. Only line charts B. Only scatter plots C. Bar charts and pie charts D. Waterfall and radar charts Q4. According to the lesson plan, what is the purpose of building a dashboard in Access? A. To analyze SQL queries B. To display various charts on one big form for database insights C. To handle database security settings D. To back up the database automatically Q5. How does charting in Access compare to charting in Excel, as per the instructor? A. Charting in Access is significantly more difficult than in Excel B. Charting in Access is impossible without macros C. Charting in Access is very similar to Excel with only a small learning curve D. Charting in Access does not support bar charts Q6. Which versions of Access are compatible with the techniques shown in this class? A. Only Access 2016 B. Only Access 2013 and newer C. Access 2007, 2010, 2013, and 2016 D. Only Access for Mac Q7. What additional resource does the instructor recommend for those interested in learning about charting in Excel? A. Access Expert Level 29 B. Excel Beginner Level 4 class C. Access SQL Seminar D. Access Advanced Level 1 Q8. What is a key structure of the instructor's course organization? A. Students must pass a final exam before advancing B. Courses are grouped sequentially in Beginner, Expert, Advanced, and Developer series C. Only Advanced courses have multiple levels D. There are only two course levels: Beginner and Advanced Q9. Where can students post questions if they need help with Access topics? A. Directly by emailing the instructor B. In the AccessLearningZone.com forums C. On Microsoft's official forums D. On YouTube comments Q10. What is advised if a student wants to follow along with the demonstration database? A. Build a new database from scratch without samples B. Download the sample database from AccessLearningZone.com databases using their password C. Use only the default Northwind database D. Request a sample database by mail Answers: 1-B; 2-C; 3-C; 4-B; 5-C; 6-C; 7-B; 8-B; 9-B; 10-B DISCLAIMER: Quiz questions are AI generated. If you find any that are wrong, don't make sense, or aren't related to the video topic at hand, then please post a comment and let me know. Thanks. SummaryToday's video from Access Learning Zone covers charting in Microsoft Access. I'm your instructor, Richard Rost, and in this class, we will be exploring how to build and use charts inside your Access database. If you've previously created charts in Excel, you already know how useful they can be. In Access, you can now integrate these same types of charts directly into your database, allowing you to generate visual representations of your information instantly with the click of a button.We'll work through several examples, including sales charts, bar charts, and pie charts. I'll also demonstrate different formatting techniques, such as working with 3D options. Toward the end of the class, we will put everything together by building a dashboard. This dashboard will display multiple charts on a single form, giving you a comprehensive view of all your important data in one place. To get the most out of this class, I recommend completing Access Expert Level 30 and the earlier courses in the series. We'll be working with our ongoing PC resale database project, so previous familiarity with that example will be helpful. Additionally, if you've taken my Excel Beginner Level 4 class, where I explain chart creation in Excel, you'll have a good foundation, though this is not strictly required. Sometimes, learning how to create charts in Excel first makes the transition to Access much more intuitive. Excel's charting tools are straightforward, and having some experience there will make it even easier to follow along today. While working in Access might present a slight learning curve, the concepts carry over nicely, so you should have no trouble adapting. This class was recorded using Access 2016, which is the first version I've used since upgrading from Office 2013. There are only minor differences between the versions, and everything taught here applies to Access 2007, 2010, 2013, and 2016. If you happen to notice anything that does not match with your version, please let me know so I can address it. I also plan to record a separate course that covers the few small updates from 2013 to 2016, but you do not need to worry about those for today's lessons. Let me outline what we'll be covering in this course. In the opening lesson, we will define what a chart is, explain the advantages of using charts, and break down the different components of a chart. The next lesson will focus on chart formatting options. After that, we'll look closer at 3D column chart formatting. The following lesson is all about pie charts, which are always a popular topic. After we've addressed those basics, we'll return to our PC resale database and begin constructing a dashboard form that brings several charts together in one place. We'll use two lessons to complete the dashboard, ensuring you can see multiple types of information simultaneously. For anyone who is new to my classes, let me quickly explain my curriculum. The main Access series is split into Beginner, Expert, Advanced, and Developer tracks. Each track contains multiple levels, and currently, the Expert series is on its thirty-first course. Ideally, you should complete these in sequence - finish all the Beginner levels, then progress to the Expert courses, and soon the Advanced and Developer content will be available as well. In addition to the structured courses, I offer a variety of seminars that target specific skills and applications. Some of these seminars cover topics such as designing web-based databases, creating forms and reports that mimic calendar layouts, securing your databases, incorporating images and file attachments, writing work orders, managing service businesses, keeping track of accounts payable, working with SQL, building loan amortization schedules, and much more. You can find more information about all my seminars on my website, AccessLearningZone.com. If you have questions, feel free to use the forums on my site. While I cannot guarantee a response to every inquiry, I and the community do our best to assist when you post questions there. For today's class, we will be using a sample database. You can download this from the databases page on my website. To access it, you will need the password for this class, which is available through your student account online. I encourage you to take your time with the material. Rewatch the video whenever you need, try building the charts and dashboards along with me, and do not hesitate to review sections if you want extra practice. Remember, Access is not difficult when you approach it step by step. You can find a complete video tutorial with step-by-step instructions on everything discussed here on my website at the link below. Live long and prosper, my friends. Topic ListWhat charts are and their usefulnessParts of a chart in Access Formatting charts in Access Creating 3D column charts Building pie charts in Access Setting up a dashboard with multiple charts Adding charts to a dashboard form in Access |
||||||||||||||||||||||||||||||||||||||||||||||||||||||||||
|
| |||
| Keywords: bar charts, pie charts, dashboards, chart formatting, 3D column charts, chart wizard, trendlines, sales dashboard, data series, chart properties, form charts, chart backgrounds, data labels, sales by rep, transparent backgrounds, chart aggregation PermaLink Microsoft Access Expert 31 |