|
|
Free Lessons Courses Seminars |
TechHelp Fast Tips Templates |
Topic Index Forum ABCD |
|
||||||
|
|
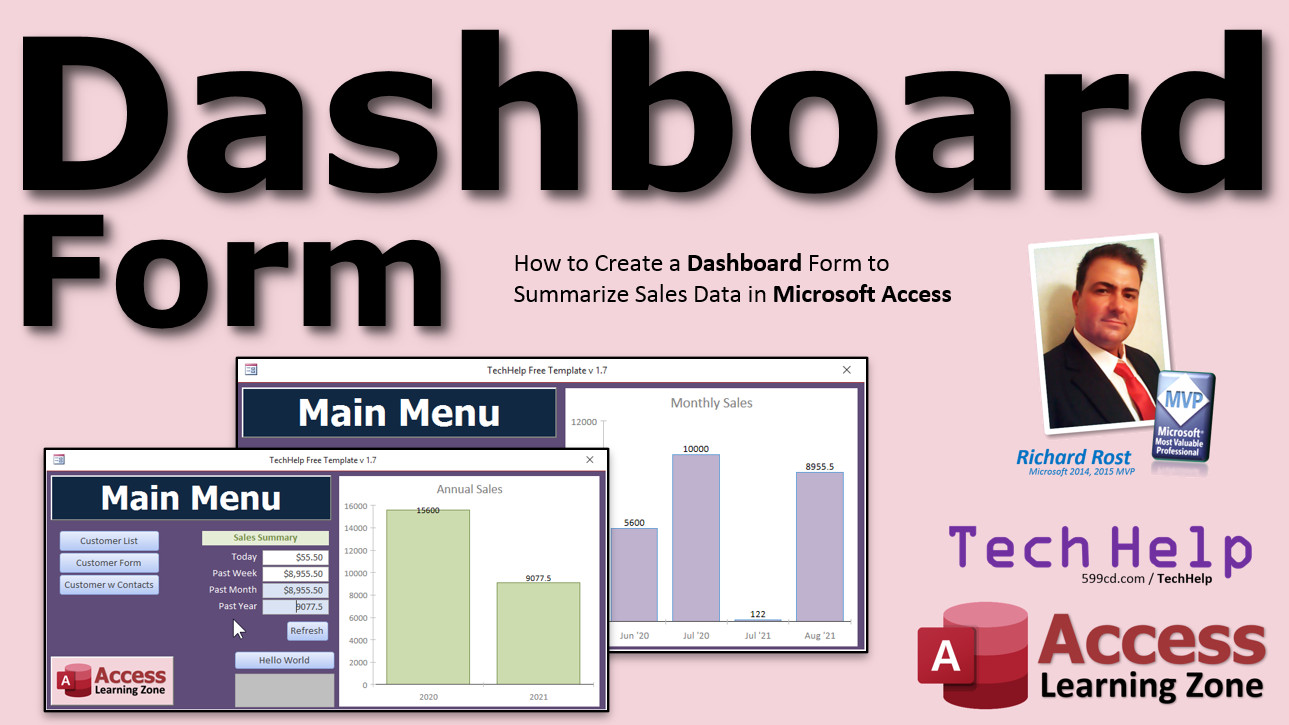
Dashboards By Richard Rost Create a Dashboard Form Using DSum & Charts In this video, I will show you how to create a dashboard form in Microsoft Access. We will use the DSum function to calculate daily and weekly sales figures, and display them with a couple of text boxes and a new Modern Chart. Tobias from Cleveland, Ohio (a Gold Member) asks: What's the best way to quickly summarize my sales for the day "at a glance" without having to run reports all the time? MembersMembers will learn how to add text boxes for monthly and annual sales, and how to switch the chart to show either monthly or annual sales. We'll also learn how to make a Refresh button that actually works.
Silver Members and up get access to view Extended Cut videos, when available. Gold Members can download the files from class plus get access to the Code Vault. If you're not a member, Join Today!
Links
Keywordsmicrosoft access, ms access, #msaccess, #microsoftaccess, #help, #howto, #tutorial, #instruction, #learn, #lesson, #training, #database, microsoft access dashboard, dashboard template, dashboard builder, visualization, dsum, dcount, Daily, Weekly, Monthly, Annual, Order Totals, criteria
IntroIn this video, I will show you how to create a dashboard form in Microsoft Access to summarize your sales data, including displaying today's sales and sales from the past week right on your main menu. We will build aggregate queries, use the DSum and NZ functions, and set up a quick bar chart with the new Modern Chart feature to visually represent monthly sales trends. This tutorial will help you add a dynamic and interactive dashboard to your database for quick and easy insights into your sales performance.TranscriptWelcome to another TechHelp video brought to you by AccessLearningZone.com. I am your instructor Richard Rost. In today's video, I am going to show you how to create a dashboard form to summarize sales data in your Microsoft Access databases, and we are going to learn the D-Sum function.Today's question comes from Tobias in Cleveland, Ohio, one of my gold members. Tobias says, "What's the best way to quickly summarize my sales for the day at a glance without having to run reports all the time?" Well, Tobias, to do this, we are going to create something called a dashboard. Now, you can create a separate dashboard form if you want, or you can just throw some stuff on your main menu. That is what I do. Then, throughout the day, whenever you want to see an update, you just go back to your main menu, hit refresh, and all your information updates. Let me show you how to do this. Now, there are some prerequisite videos I want you to go watch first. If you have not watched my invoicing video, which is based on my TechHelp free blank template, go watch that first. I will put links to all this stuff down below. These are all free videos. Go watch aggregate queries. We are going to make an aggregate query to group our sales together. Then, I want you to watch the DLookup, DCount, and DMax videos. At least watch DLookup first. We are going to use a function today called D-Sum to sum up a group of records to get an order total. It is a close relative to these other three, so watch DLookup first, then go watch those other two. Today we are going to learn D-Sum. Of course, the NZ function is very useful. It is for converting null values to zeros. Go watch that too. Go watch all these videos right now. Pause this one, come back to it, then we will move forward. OK, you are back. Here we go with the new stuff. Here I am in the TechHelp free template, again, a free download from my website. In here, we have customers and each customer can have an order. The orders are saved in the order table, but this does not give you any information about the total for the order. That is stored in the order detail table. You have your unit price here, the quantity, so that gives you each line total. Then, we have a query called order detail Q that takes the quantity times the unit price and gives you the extended price. If you take all the extended prices for the same order ID, that gives you the order total. To make things easier when we are doing our dashboard, we are going to make an order summary query that just sums up the order total for each order. Let's make that real quick. This is going to be an aggregate query. We are going to create query design. We are going to bring in the order table and then our order detail Q because that has the extended price in it. So what fields do we need in our order summary query? We want the order ID. The order date is necessary. We care if it is paid. For this query, I am only going to show the paid orders if it is true or not, and then I need the extended price. Now, if memory serves, I do not think I marked any of these guys as paid. Let us go mark these orders paid. Now, let us turn this into a total query or an aggregate query, and we are going to change extended price to sum. These will all get grouped by, which these are all the same for every order, and then extended price gets added up. Save this as my order summary Q. If I run it now, you can see I have got one entry for each order. There is the sum right there, sum of extended price. Let us rename now. Let us give that an alias instead of sum of extended price. Let us call this order total: That is how you rename a field. It is called an alias. If you want to format that as currency, there are a couple of ways you could do it. You could try right clicking here and going to properties, then changing the format here, but that does not always work. Let us see. Sometimes it does, sometimes it does not. OK, in this case, it does. If not, you have got to use the format function. Now, let us go change the dates on our orders because this template was built a few months ago. You can see the dates in here. We are going to be doing a summary on our main menu to show today's sales and the sales from the past week. Let us change these dates in these orders. Today is August 3, 2021. I will make this one from today, August 3. Let us go to the next one. Let us make this one from August 2nd. Then we will make this one from something that should not show up. Let us go with July 1st and give it some numbers. We have got three orders in the system. Let us take a look at our summary query again. There we go. August 3rd, August 2nd. That is a pretty big order, though. Let us change that amount. That is kind of silly. Let us go back to the order form and let us change this to 2 and 3. How does that sound? Order summary. It is a little more reasonable. We are going to use the D-Sum function, and we are going to sum up the order total field from the order summary Q where the order date is today's date. For our weekly one, we will say where the order date is greater than 7 days ago. We know how to use the DLookup function. Let us now do the D-Sum function. I just put a section right here on my main menu. I like to put a label across the top of it like this. Put in here like sales summary like that, and then give it a little format. Maybe make it green, so let us go dark green, then maybe a light green behind it, something like that. Bold it, center it. Looks kind of neat. Then we will put down here our actual value. Let us go grab a text box, drop it there, make this guy white so we can actually see it. This one will be today, today's sales. Slide it over like this, move you over here, and maybe we will right align that one. So today's sales will go right in this box. How do we do that? Open up the properties for this text box. Let us give it a name first. Go to the all tab. Let us call this one sales today. In the control source, we are going to put our D-Sum function. I am going to zoom in, Shift F2. Equals D-Sum. What am I looking up? Order total. In double quotes, comma, from where? Order summary Q, comma, where the order date is greater than or equal to, and then we are going to put today's date inside of the little hashtag symbols, right, these guys. That is going to be outside the string. A little string concatenation there. Order date is greater than or equal to today's date. Now, why do not I just say order date equals today's date? Because sometimes people put date and time in their date fields. If you have got your order date field in your table, if you give it the ability to accept time values, you want to take that into consideration. If someone types in 8/3 at 5 p.m., then this will not show that data. I always try to take that into consideration, even if I am making them just enter in dates. I always try to think of that time factor. Now, this whole thing, I want to enclose inside of the NZ function, just in case there are no sales for today. You do not want to see a null value or an error there, so we will just return a 0. Hit OK. Let us save this, close it, and reopen the main menu. There we go. There is our 55.5. A little formatting, maybe, design view. Open up this guy, format, currency. Maybe we will right align that. Save it, close it, open it back up again. There you go. There are your sales from today. That number, order summary from today, 55.50. Let us change one of the other orders to today's date as well and make sure that this date refreshes itself. Let us go to the order table. Let us change this order here to 8/3 as well. Just to make sure that our formula is working right, let us say that this person put it here at 6 p.m. If I just come back here to the main menu, it is not going to refresh. You have to hit the refresh button up here. That will refresh the form data, or hit F5 on your keyboard. Can you make a button down here? Yes, you can, but it involves a little bit of programming. It involves one line of VBA code. There is a button on the wizard, but it does not work. It only works for forms that have data behind it that are bound to a table. For an unbound form like this, the command button wizard does not work. I do not really like the command button wizard that much. That is why I like to try to teach you a little bit of VBA, just a couple of lines of code here and there. You can really make your databases powerful. Let us go put that other order back so it does not show up anymore. Let us go put this back to the 6.72. Close that. Let us refresh it again, F5. Now, let us do the past week. Back to design view. I am just going to copy and paste this text box. Copy, paste, Ctrl-C, Ctrl-V. Slide that up there. Past week. What did I call this one? Sales today. Let us call this one sales week. Let us edit the control source. It is going to be the same thing. Look up the order total from the order summary Q where the order date is greater than or equal to date minus 7. That is a week ago. See how easy that is? This is a little string concatenation here, folks. By the way, if you do not know what this is, this is how you take two strings and put them together. You want the actual date value outside of the string so Access has to evaluate this and then puts the actual date in here. You do not want to send this to the function. Sometimes you can, but it is a good idea not to be in that habit. Hit OK. Save this. Close it. Open it up again. There you go. There is your big order, including today. The past week sales are also going to include today's sales. For the extended cut for the members, I am going to also show you the past month and the past year. It is slightly different. We will use the DateAdd functions. But hold on, we are not done. We are not done with the free video yet. Let us put a little chart over here. Let us do a little bar chart showing our monthly sales, so you can see the trend of the bars. A quick little bar chart over here. Let us go back to design view. Now, in recent versions, I think 2016, Microsoft added a new chart type called the Modern Chart. In fact, it is so new I have not even covered this fully in my regular classes yet. I covered the old chart object right here in Access 31, Access Expert 31. There are a lot of different chart types in here in the old one. Bar charts, pie charts, lots of kinds of stuff. It is pretty robust. The Modern charts are pretty new and they are cool, and they look a lot better, but there are still some quirks in them. So, I have not taken the time to cover these fully yet. But let me go through and show you how to do a real simple column chart. Let us come over here and draw a little chart. This stuff just hides it immediately. I am going to slide this over and just drop a little chart right there on your form. We will do like this. First thing you want to work on is the chart settings. What is your data source? Let us go and find our order summary query that we just made. Let me give you a little preview here. That is not what you want. The Access, the category, is going to be the order date. You can pick what you want to see over here. You want to see months, years, quarters, days. Let us do monthly sales. Show them monthly sales. Legend, leave as blank, as none. The values are going to be the order total. There is the order total, and there are the months. You can see right there what it is going to look like. Go over to format. Give it a display name if you want to, monthly sales. If you want to change the color, you can change the color right here, the bar color. I kind of like that, the blue outline with the purple in there. If you want to see a data label, that will show you the exact amount of sales. If you want to see a trend line, you can add a trend line. Sales are going up. Close the chart settings. Then let us open up the property sheet. There are a couple of things I want to show you on here that are neat. But first, a real quick advertisement. I know a lot of you bail as soon as the lesson is over, but if you really want to learn about charting and stuff like that, Access Expert 31. I cover all kinds of stuff, different kinds of charts. These are the classic charts, but these ones work really well. They've been in Access for years and Excel, pie charts, and all kinds of different things. Access Expert 31. If you want to learn about charting, multiple data series charts, 3D charts, forecasting, we do a lot more with chart dashboards and so on. Back to the lesson. We are going to give our chart a name. Let us call this sales chart or whatever. Always give your objects names if you can. Over to the format tab here. I like to turn off, for just one data series in here, I am going to turn off the legend. See where it says "has legend"? Turn that off. That thing up top there, you do not need that. Goodbye. Chart title, monthly sales. It is kind of self-explanatory, but it looks nice. If you want to use chart titles, you can put them down here. Category axis title, primary axis title, secondary axis title. You can put month, which shows up on the bottom down there. You can put sales in here for the secondary axis. This guy shows up vertically like that. That is kind of neat. Or, if you do not want them, turn it off. You get more space. There are all kinds of others. You can set the width, the height, the colors, the padding around it, all kinds of stuff in here. All these are in the property sheet. So let us save this, close it, and open it back up again. We will have to make this bigger. Do not forget to put that. Thank you, about there. Save it, close it, open it up one more time. There we go. If you had more data in here, let us say, let us put another order in. Let us put an order in from June 15th for this person for $600, and it is paid. Close it. Come back over here. Refresh, F5. Look at that, it updates. It might go negative here if you have got the trend line because it is forecasting backwards this way. Personally, I almost never use trend lines because trend lines are meaningless. One month could be very different from the previous one or the next one. This is basically now the start of a dashboard. You can quickly and easily see what today's sales were, your past week, and what your monthly sales have been. I think I am going to turn off that trend line, and I am going to put the data labels on. Now, let us see what that looks like. I like that better. I think that looks nice. Want to learn more? In the extended cut for the members, I am going to show you how to add the past month and the past year to your sales figures. We will add a refresh button. I will make a button that works instead of the one on the command button wizard that does not work. Then, I will show you how to switch the charts. You will go from monthly sales to annual sales. See that? Two different charts there. That is all covered in the extended cut for the members. It is 15 minutes long. It is a pretty good video. Silver members and up get access to all of my extended cut videos, not just this one. All of them. There are almost 200 now. There is lots of stuff to watch. Gold members can download my database templates from these videos. How do you become a member? Click the join button below the video. You will see a list of all the different types of membership levels that are available. Silver members and up get access to all of the extended cut TechHelp videos, live video and chat sessions, and more. Gold members get access to a download folder containing all the sample databases that I build in my TechHelp videos, plus my code vault where I keep tons of different functions that I use. Platinum members get all the previous perks plus access to my full beginner courses and some of my expert courses. These are the full length courses found on my website, and not just for Access. I also teach Word, Excel, Visual Basic, ASP, and lots more. Do not worry, these free TechHelp videos are going to keep coming. As long as you keep watching them, I will keep making more. If you liked this video, please give me a thumbs up and feel free to post any comments that you have. I do read them all. Make sure you subscribe to my channel, which is completely free, and click the bell icon and select all to receive notifications when new videos are posted. Click on the Show More link below the video to find additional resources and links. You will see a list of other videos, additional information related to the current topic, free lessons, and lots more. YouTube no longer sends out email notifications when new videos are posted, so if you would like to get an email every time I post a new video, click on the link to join my mailing list. If you have not yet tried my free Access Level 1 course, check it out now. It covers all the basics of building databases with Access. It is over three hours long. You can find it on my website or on my YouTube channel. If you like Level 1, Level 2 is just one dollar, and it is also free for all members of my YouTube channel at any level. Want to have your question answered in a video just like this one? Visit my TechHelp page and you can send me your question there. Click here to watch my free Access Beginner Level 1 course, more of my TechHelp videos, or to subscribe to my channel. Thanks for watching this video from AccessLearningZone.com. QuizQ1. What is the primary purpose of creating a dashboard form in Microsoft Access, as discussed in the video?A. To replace the need for tables in Access B. To quickly view summarized sales data at a glance C. To generate paper invoices D. To input raw sales data into the database Q2. Why is the DSum function used in the context of the video? A. To count the number of orders in a table B. To display only the most recent order C. To sum a group of records, such as order totals D. To look up customer details Q3. What prerequisite concepts does Richard recommend you review before following along with the dashboard tutorial? A. How to use Excel PivotTables B. DLookup, DCount, DMax, and the NZ function C. VBA programming for automation D. How to create macros Q4. In the sales dashboard, why is the NZ function used in conjunction with DSum? A. To prevent divide by zero errors B. To return the field name instead of a value C. To convert null values to zeros, avoiding errors when there are no matching sales D. To filter only unpaid orders Q5. In setting up the order summary query, what is the main function of an aggregate query? A. To sort data by customer name B. To filter out unpaid orders from the table C. To group and summarize sales data, such as calculating order totals D. To add new records to the table Q6. Why does Richard recommend using a condition like "order date >= today's date" instead of "order date = today's date" when filtering today's sales? A. To include future orders B. To capture records with time values in the date field C. Because Access does not support the equals operator D. To exclude canceled orders Q7. What is the best method for formatting a field as currency in a query if right-clicking and changing the property does not work? A. Use the Format function in the query B. Change your computer's regional settings C. Convert the field to text D. Add a new field to the table Q8. What needs to be done for the dashboard data to update after adding or editing orders? A. Close and reopen Microsoft Access B. Hit the refresh button or press F5 to reload the form data C. Clear the cache in Access D. Manually update each text box Q9. What is a limitation of the command button wizard when adding a refresh button to an unbound form? A. It only creates buttons for reports B. The wizard does not work for unbound forms; a VBA solution is needed C. It erases existing form controls D. It only works with subforms Q10. When summarizing past week's sales, how is the date condition constructed in DSum? A. order date = date B. order date < date - 7 C. order date >= date - 7 D. order date > date + 7 Q11. When adding a bar chart to the dashboard, which data source should be used to display monthly sales? A. The raw order table B. The order summary query C. The customer table D. The paid orders report Q12. Why might you want to turn off the legend when creating a simple single data series chart in Access? A. To make the chart non-interactive B. To disable color coding C. Because the legend is unnecessary and wastes space for a single data series D. To enable trend lines Q13. According to the video, what might you need to do if you want to add a refresh button that actually works with your custom dashboard? A. Use a parameter query B. Write a small VBA code to trigger the refresh C. Add a hyperlink to refresh the page D. Enable macros in the database options Q14. What is a possible pitfall of using trend lines in sales charts, according to Richard? A. Trend lines are required for all charts B. Trend lines can be misleading since sales vary from month to month C. Trend lines delete data points D. Trend lines only work with pie charts Q15. What is one benefit mentioned for Gold level members on the AccessLearningZone membership? A. Access to advanced Excel formulas B. Ability to download all database templates built in the TechHelp videos C. Free Microsoft Access license D. Guaranteed personal email support Answers: 1-B; 2-C; 3-B; 4-C; 5-C; 6-B; 7-A; 8-B; 9-B; 10-C; 11-B; 12-C; 13-B; 14-B; 15-B DISCLAIMER: Quiz questions are AI generated. If you find any that are wrong, don't make sense, or aren't related to the video topic at hand, then please post a comment and let me know. Thanks. SummaryToday's video from Access Learning Zone focuses on building a dashboard form in Microsoft Access to help you quickly summarize sales data. Specifically, I will be showing you how to use the DSum function to display sales figures such as daily and weekly totals right on your main menu.Tobias wanted to know how to get a quick sales summary without having to run reports every time. The best solution is to set up a dashboard. You can create a dedicated dashboard form, or just add the summary information to your existing main menu. Personally, I prefer updating my main menu so whenever I want to check up-to-date sales numbers, I simply refresh the menu and see the latest data. Before we dive into the process, there are a few prerequisite topics to review to make sure you are ready for this lesson. If you have not already watched my videos on building an invoicing system using the free TechHelp template, be sure to check that out first. Additionally, I recommend learning about aggregate queries, since we will use one for grouping sales. Videos explaining DLookup, DCount, and DMax are also valuable background, but make sure you are at least familiar with DLookup, as DSum is closely related. Lastly, the NZ function is very helpful for converting nulls to zeros. Take a moment to catch up on those topics before continuing. Assuming you are ready, let us get started with the new material. In the free TechHelp template, every customer can have multiple orders, which are stored in the order table. The order totals, however, are not stored directly in that table; they are calculated from the order details. Each order detail line includes a unit price and quantity, so the total for a line is the product of those two values. There is a query already set up, called order detail Q, that calculates these extended prices. Summing the extended prices for all the lines belonging to the same order gives the total for that order. To simplify dashboard creation, we need a summary query that lists each order's total. To build this, create an aggregate query that pulls in both the order table and the order detail Q. Include the order ID, order date, a field indicating whether the order has been paid, and the extended price. Make sure only paid orders are shown. Convert this to a totals query, group by the appropriate fields, and sum the extended price field to get the order total. Give the summed field an alias, such as "OrderTotal," to keep things tidy. If you want, format the result as currency; you can do this either in the query properties or with the Format function. Next, you need to ensure your sample orders have relevant dates. Update order dates as needed so you have some that fall on today's date, others from yesterday, and perhaps a few from a previous month. This way, when you test your dashboard, you can see totals for today and for the past week. To show today's sales on your dashboard, you will use the DSum function to sum the OrderTotal field from your summary query, restricting the calculation to records where the order date matches today's date. For the weekly total, you will set the criteria to sum everything from the last seven days. Remember to use the NZ function to handle situations where there are no sales, so you display a zero instead of a null value. On your main menu form, create a section for sales summary. Add a label for the section title, format it to stand out, then add text boxes to display the actual figures. For each text box, give it a meaningful name (for example, SalesToday) and in the control source, use the DSum formula discussed above. When setting the criteria in DSum, instead of using an equals sign for today's date, use greater than or equal to, because sometimes people enter date and time values. This ensures you catch all sales for the day, even if a time value is involved. Access does not automatically refresh unbound forms, so after updating any order data you need to manually refresh the form. You can do this using the refresh button or by pressing F5. If you want a refresh button right on your dashboard, a bit of simple VBA coding is required, since the command button wizard only works with bound forms. Learning a line or two of VBA can really empower you to create more interactive databases. For the weekly sales summary, duplicate your daily sales text box and update its formula so the date criteria uses today minus seven days. Make sure you use string concatenation correctly so Access interprets your date values properly. Again, wrap everything in NZ so that empty result sets show zero. Members will also learn in the extended cut how to set up similar calculations for monthly and yearly figures, using functions such as DateAdd. To enhance the dashboard further, I recommend adding a bar chart that visualizes your sales by month. Modern charting tools are available in recent versions of Access and they provide a much more visually appealing result. Create a new modern chart on your form and connect it to your order summary query. Set the category to order date (grouped by month) and the values to order total. Tweak the format, color, and display names as desired. You can also add data labels for exact values or, if you like, a trendline (though personally I find these can sometimes be misleading for small sets of data). Give your chart a descriptive name in the property sheet, remove legends if unnecessary, and set axis titles if you want extra clarity. There are many formatting options available here, such as adjusting bar colors, removing padding, or resizing the chart. Save everything, and when you open your main menu, you will see your updated sales bar chart alongside your daily and weekly summaries. If you add more orders or change their dates, remember to refresh the dashboard to see the updated totals and new chart entries. The modern chart control has its quirks, but it is quite a step up from the classic chart options, which I covered in depth in my Access Expert 31 class. If you want to become more proficient with charting, that class dives into different chart types, forecasting, multiple data series, and more. This dashboard now gives you an up-to-date overview of daily sales, weekly totals, and historical sales by month. It is a great way to monitor business performance at a glance. In today's extended cut, I will show members how to expand the summary to include monthly and yearly sales using DateAdd, how to add an effective refresh button, and how to switch your chart view between monthly and annual sales data. Silver members and above get access to all extended cut videos, live chat sessions, and more. Gold members can download database templates and my code vault, while Platinum members get all of that plus access to my full-length courses on Access, Excel, Word, Visual Basic, ASP, and more. My free TechHelp videos will continue as usual, so keep watching and subscribing. Remember, you can find a complete video tutorial with step-by-step instructions on everything discussed here on my website at the link below. Live long and prosper, my friends. Topic ListCreating an order summary aggregate querySumming order totals using extended price Renaming fields with aliases in queries Formatting currency in Access query results Filtering order summary data by date Using the DSum function in a form control Combining DSum with NZ to handle nulls Summing today's sales with DSum and date criteria Summing past week's sales with DSum and date arithmetic Adding summary calculations to a main menu form Formatting and positioning controls on a dashboard Refreshing unbound forms manually in Access Adding a basic VBA refresh button explanation Adding and configuring a modern chart in Access Setting chart data source to a summary query Adjusting chart properties such as titles and axis labels Adding data labels and trend lines to charts Testing dashboard summaries and chart updates with new data Naming form and chart controls for clarity Customizing the appearance of a dashboard form |
||||
|
| |||
| Keywords: TechHelp Access microsoft access dashboard, dashboard template, dashboard builder, visualization, dsum, dcount, Daily, Weekly, Monthly, Annual, Order Totals, criteria PermaLink Dashboards in Microsoft Access |