Crosstab
By Richard Rost

 4 years ago
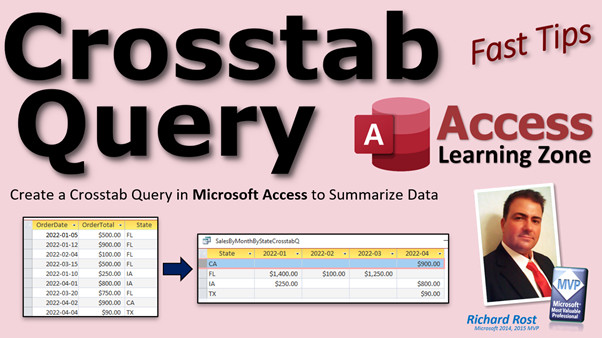
Crosstab Query: Summarize Data from Two Fields
A crosstab query is a special kind of query that performs an aggregate function (sum, average, count, max, min, etc.) on two separate fields. So, for example, you can get the sum (aggregate) of sales by state (field 1) by month (field 2); or you could calculate the count of sales reps (aggregate) for each territory (field 1) for each product line (field 2). The possibilities are endless, and this is a great way for you to see trends in your data.
Pre-Requisites
Recommended Courses
Keywords
access 2016, access 2019, access 2021, access 365, microsoft access, ms access, ms access tutorial, #msaccess, #microsoftaccess, #help, #howto, #tutorial, #learn, #lesson, #training, #database, #fasttips, crosstab queries, crosstab query, like pivottables in excel, pivot tables, Make summary data easier to read by using a crosstab query, What is crosstab query, How do I create a crosstab query, How to Create a CrossTab Query, How to use the Crosstab Query Wizard, data analysis, trends, by month, row heading, column heading
 Subscribe to Crosstab
Get notifications when this page is updated
Intro In this video, we will talk about how to create crosstab queries in Microsoft Access to summarize your data, similar to pivot tables in Microsoft Excel. I will show you how to transform a table of order data into a summary by month and state, including building calculated fields for month and joining tables to bring in customer state information. You will learn how to use the Crosstab Query Wizard to generate these summaries and see practical examples to make your reports more meaningful.Transcript Welcome to another Fast Tips video brought to you by accesslearningzone.com. I am your instructor, Richard Rost.
In today's video, we're going to talk about cross tab queries and how you can use them to summarize your data. What is a cross tab query? Well, a cross tab query lets you take a whole bunch of seemingly random information like this. You have order dates and order totals and what state the customer is from. You can take that and put it into something that looks a lot more meaningful.
Here you can see a summary based on each state and based on each month. Those are cross tab queries. If you're familiar with Microsoft Excel, cross tab queries are very similar to pivot tables. Here are some sales and expenses. For example, I have different stores: Buffalo, Chicago, Toronto. Here's the year over here. It goes down, 2001, 2002, and so on. Yes, this is an older class. I stole my own screenshots from one of my older Excel classes.
You have the store, the manager, sales, and expenses. Again, looking at this, it's very hard to see any kind of pattern, but you can summarize it with a pivot table. Here you've got the store and then each year. You can put totals on there if you want to. The reason why they call it a pivot table is because this has the store over here as the row header and the year over here. You can pivot that and flip it around. You can put the year over here and the store across the top if you want to.
You can summarize it this way down here. I've got another one where you have the manager over here and each location. That's why they call it a pivot table. You can rearrange the fields and the columns and the rows and all that stuff. You can do pretty much the same thing in Microsoft Access. It's not as easy as dragging those things around in Excel, but if you want it in Access, I'll show you how to do it. Here we go.
Before we get started, I have some prerequisites for you. Go watch these videos first. These are free. They're on my website and my YouTube channel. I want you to know what calculated query fields are. You're going to make a calculated field in a query. Watch this video on the format property and function. We're going to format a date value to be just year and month. We're going to do that with the format property, actually the format function in this example.
You should understand table relationships between customers and orders or vendors and products, relationships between multiple tables. That's important. It would be helpful to understand cross tab queries if you first know what an aggregate query is. That's where you can group stuff together, basically, on just one value. Just put all the months together or put all of one customer's sales together. A cross tab query, we're going to do it with two axes. An aggregate query is basically just one summary. Enter in that first and then come back and we'll do the cross tab query.
My goal is to take this kind of data where I've got a list of orders: the order total and what state the customer is from. I want to see sales by month by state. I've got the state the customer is from here as the row header. I've got the month of the sales and then a summary of all the sales for that state for that month.
And some people ask why would I want to do that? Sometimes if you're running a large store or something and you have 15 locations, you might want a breakdown of all the sales per month per store. You could see which stores are performing and which ones aren't. This is just an example that I picked that I think everyone can relate to.
Now if you've been following my TechHelp series at all, this is the TechHelp Free Template. You can get a free copy of this off the website. I modified it slightly for this example just to make things easier. Normally we've got orders and we've got order details. If you go into the order form here, I removed some things like the notes field and descriptions. Normally we've got the order date, the customer, and then we have the line item details that are stored in order details and we sum those up to get the order total.
To keep things simple for this example, I just basically got rid of order details. So we're going to delete order details. What I did was I cheated it and I put an order total right here in the order table. Normally you would bring those together in a query and you just summarize the order total there. But to keep this example simple, we've got the order ID, the customer, so we know where the customer is from so we can get the state. There's the order date to the day and the order total.
What I want to do is take a look at this information and put it in the format that I said before. I want state and month. We're going to tackle this problem in multiple steps.
The first thing I want to do is get a list of all of my orders with just the month because I have to have these so it's just year and month, year and month. I don't want to summarize the whole date because then it will put each day together. I want just the month. So let's tackle that problem first. Let's close this. Let's create a query: Create, Query Design, bring in your order table. You're going to get that right now.
I want the order date and I want the order total. Run that and you'll see there's your order date and your order total. I want this to be just the month. So I'm going to format this as year and month using the format function. I want you to watch that format function.
Come back in here and in this field here for order date, I'm going to shift-F2 to zoom in so you can see this better. I'm going to make a calculated query field. I'm going to call it order month. That's the name of the field now and it's going to be format, the order date, comma, yyyy-mm, just like that. I'm going to take the whole order date and just get the year and month out of it.
Now let's take a look at what we got. There it is. There's just the order month for each order. Now keep in mind this is no longer a valid date field because that's not a date. It's formatted as text now. So it's just year and month but that's okay. That's actually fine for our cross tab query for display purposes and for reporting. This works just fine.
Now if I only wanted a breakdown of sales by month, this is where I could just use an aggregate query by one axis. So I could just say, OK, turn the totals on and then sum up the order total. Then run and it will group by each month. See that? There's the sum of the order total for all of the sales for all of the customers for March 2022.
But I want to go deeper than this. I want month and what state they're from so I can see what stores are doing better. But this is a good first step.
Now I'm going to bring in the customer so I have the states as well. Let me turn off the totals, by the way. We don't want an aggregate here. Let's turn that off. I want them all, and now I'm going to bring in the states. I've got the state here. Now how do we get the state? We'll be joining our customer table.
So we're going to add tables. CustomerT, close that. Now you could make this a left join here if you want to, if you have orders that don't have customers, but I'm going to assume in my database every order has to have a customer. It's required.
So I'm going to now find the state field and just bring that into my query. Now I've got all the data that I need to build my cross tab query. Of course, if this is a real working database, in your order table I took some extra fields out of here. You've got a paid checkbox in the actual database to know if each order was paid. You can put a query criterion on to make sure you're just looking at paid orders.
But I got everything I need here to build my cross tab query. So let's go in here and save this. We're going to call this sales by month by state.
Sales, by the way, is probably the only exception that I have to using my plural versus singular rule. I always make customerT instead of customersT. But sale, just sales sounds odd. So I always go with sales. You always talk about sales, or how are your sales, not how's your sale. It's one sale, I don't know. Anyways, I always use sales.
That query is done. Now, it is time to roll out the cross tab query wizard. I like this wizard. It's a good wizard. Access has good wizards and bad wizards. There are some good wizards and there are some bad wizards. I like the cross tab query wizard because it makes the job pretty easy for you.
Honestly, some things are easier to do without the wizards once you get good at them because you do them a lot. To be completely frank, I don't use cross tab queries a lot myself. I teach them, but as far as in real life, once in a blue moon, I might make a cross tab query. You can do it manually in design view in the query, but it's easier with the wizard. I like to make it with the wizard and then if I have to tweak it, I'll go into design view.
So, create, not design, go to Query Wizard. I very seldomly use these wizards here. Don't use the simple query wizard. This is okay. These two are okay, but it's easy. I can show you how to do these easier without those. Cross tab query, which is probably the one that I come in here for the most.
Hit OK. The first step is easy: which table or query contains the fields you want in the cross tab query results? You have to put all your stuff together. You can only pull in one data source in here, one table or one query. We're going to go to queries. That's why you have to put it all together in a query first. We put customers and orders together, and we're going to pick these sales by month by state and hit Next.
Which fields do you want as the row headings? These are rows, records. What do you want over here? I'm going to put the state in the row. Yes, you can actually have multiple rows in here. You can go deeper with this, for example, if you have country and then state, you could break it down that way. Next, what do you want across the top as the column headings? That's going to be our order month.
Next. Now this one's kind of weird. This is what you want for your data, but notice it says average of order total in here. So by default, they're going to show you the average of all your orders. I don't want that. So the first thing is change that to sum. These are all the different functions you could pick: count, first, last. Count I use a lot too, to count something, like how many orders did you get from each state. You might want the average. For this example, I want the sum of my sales for each state for each month.
Over here, this says include row sums. That's basically do you want a sum for the entire row? Do you want a sum for all of New York, all of California? I'm going to turn that off. I don't want that right now. If you want to play with it and turn it on, go ahead.
I'm going to hit Next. Change the name just slightly. I like to put my "Q" on the end, and I don't like underscores in my query names. All right. Hit Finish. And boom. There it is. That's it. The wizard does all the work for you.
Now, of course, lots of questions come up at this point. What if you want to see zeros in here instead of blanks? What happens if you're missing sales in February? Can you still show this with zeros in here? Yes, you can, and I cover that in my Access Expert Level 17 and 18 classes.
Access Expert 17 covers a bunch of stuff, including archiving old orders and union queries, which is merging two tables together. Then we start cross tab queries, where we do something very similar to the example we just did.
Then in Expert 18, we cover all kinds of extra stuff with cross tab queries. For example, parameters, or how to put parameters in there in case you want to do from one month to another month, find unmatched queries, Cartesian products, and more. I'll put links to both of these classes down below if you want more information. Click on those or drop a comment.
So that's your Fast Tip today on cross tab queries. I hope you learned something. Wait for it. We'll see you next time.
How do you become a member? Click on the Join button below the video. After you click the Join button, you'll see a list of all the different membership levels that are available, each with its own special perks.
Silver members and up will get access to all of my extended cut TechHelp videos, one free beginner class each month, and more. Gold members get access to download all of the sample databases that I build in my TechHelp videos plus my Code Vault where I keep tons of different functions that I use. You'll also get a higher priority if you decide to submit any TechHelp questions to me, and you'll get one free expert class each month after you finish the beginner series.
Platinum members get all the previous perks plus even higher priority for TechHelp questions, access to all of my full beginner courses for every subject, and one free developer class each month after you finish the expert classes. These are the full length courses found on my website, not just for Access. I also teach Word, Excel, Visual Basic, and lots more.
You can now become a Diamond Sponsor and have your name or company name listed on a sponsors page that will be shown in each video as long as you are a sponsor. You'll get a shout out in the video and a link to your website or product in the text below the video and on my website.
But don't worry, these free TechHelp videos are going to keep coming. As long as you keep watching them, I'll keep making more and they'll always be free.Quiz Q1. What is the primary purpose of a cross tab query in Microsoft Access?
A. To create random data sets
B. To convert data into graphical charts
C. To summarize data using rows and columns based on two fields
D. To automatically delete duplicate records
Q2. Which Microsoft Excel feature is cross tab queries in Access most similar to?
A. Formulas
B. Macros
C. Pivot tables
D. Conditional formatting
Q3. In the provided example, which two fields were summarized using the cross tab query?
A. Store and product
B. State and order month
C. Customer and order date
D. Sales and manager
Q4. Why is it necessary to format the order date as year and month in the query?
A. To eliminate duplicate records
B. To ensure the data fits within Access's character limit
C. To group data monthly rather than daily
D. To make the report look more colorful
Q5. What is a calculated query field in this context?
A. A field that stores images
B. A field that performs a calculation on another field's data in a query
C. A primary key field
D. A field that only accepts text input
Q6. Why did the instructor remove the order details table for this example?
A. To add more complexity to the database
B. To make the example simpler and focus on the main query concepts
C. Because order details were not required for cross tab queries
D. To demonstrate linking unrelated tables
Q7. What is the main difference between an aggregate query and a cross tab query?
A. Aggregate queries summarize data along one axis, cross tab queries summarize along two axes
B. Aggregate queries are only available in Microsoft Excel
C. Aggregate queries require VBA code
D. Cross tab queries cannot be used with calculated fields
Q8. What must you do before using the Cross Tab Query Wizard?
A. Make sure all data is in a single table or query
B. Create only tables but not queries
C. Delete all calculated fields
D. Convert all data to images
Q9. Which field was used as the row heading in the cross tab query example?
A. Order total
B. State
C. Order date
D. Customer name
Q10. When creating the cross tab query, which function was selected for summarizing order totals?
A. Count
B. First
C. Average
D. Sum
Q11. Why might you want to include row sums in a cross tab query?
A. To see the total for each row (such as total sales per state)
B. To format rows in bold
C. To remove duplicate records
D. To change the color of rows
Q12. According to the video, what should you do if you want to see zeros instead of blanks in your cross tab results?
A. Select the "Count" function in the wizard
B. This is covered in Access Expert Level 17 and 18 classes
C. Cross tab queries always show zeros by default
D. Change the query to a report
Q13. Why is the format "yyyy-mm" used with the order date field?
A. It sorts alphabetically only
B. It formats the date as day first, then year
C. It creates a text representation suitable for grouping by month and year
D. It is the only format Access can read
Q14. What is the main advantage of using the Cross Tab Query Wizard in Access?
A. It is the only way to create queries in Access
B. It always displays all tables automatically
C. It simplifies the creation of cross tab queries by guiding the user step by step
D. It sets up macros for automation
Q15. If you want to analyze how many orders came from each state, which aggregate function could you use instead of Sum in the cross tab query?
A. Last
B. First
C. Count
D. Average
Answers: 1-C; 2-C; 3-B; 4-C; 5-B; 6-B; 7-A; 8-A; 9-B; 10-D; 11-A; 12-B; 13-C; 14-C; 15-C
DISCLAIMER: Quiz questions are AI generated. If you find any that are wrong, don't make sense, or aren't related to the video topic at hand, then please post a comment and let me know. Thanks.Summary Today's video from Access Learning Zone focuses on cross tab queries and how you can use them to summarize your data in Microsoft Access. I want to explain what exactly a cross tab query is and why you might want to use one. Imagine you have a lot of data, such as order dates, order totals, and the states your customers are from. With a cross tab query, you can take all of that information and present it in a much more meaningful way.
To give you something familiar, if you have used Microsoft Excel, cross tab queries work a lot like pivot tables. For example, picture you are tracking sales and expenses for stores in Buffalo, Chicago, and Toronto, with data sorted by year. Looking at raw data, it is difficult to see patterns, but a pivot table summarizes it so you can clearly see totals for each store or year. The reason it is called a pivot table is because you can swap or "pivot" your row and column headings. For instance, you might show store names as rows and years as columns, or flip it so years are the rows and stores are columns. You can also break it down further, putting managers as rows with stores as columns. This lets you rearrange your fields until you have the view you need.
You can build very similar reports in Access using cross tab queries. While it isn't quite as simple as dragging and dropping like in Excel, Access provides you with tools and a wizard to set these up. I'll walk you through the process.
Before starting, there are some things you should be comfortable with. Be sure to check out my free tutorials on calculated query fields, since you will need to create those. You should also know how to use the format function to turn a date into just a year and month, which is useful for summarizing data monthly. Understanding how to relate tables like customers and orders is important, too. Finally, knowing what aggregate queries are will help, as those are like cross tab queries but only summarize by one field. Aggregate queries group, for example, all sales in a month together. In a cross tab query, you are grouping by two axes, such as month and state.
The overall goal here is to take order data, which includes order totals and the customer's state, and summarize it so you can see sales by month for each state. With the state as the row header, and the month as the column header, you will get a grid showing total sales for each state by month.
You might wonder why you would use this. If you manage several locations, it's often useful to see a breakdown showing total sales per month per store or state. This way, you can quickly spot which stores are performing well and which need attention. This example keeps it simple and should be easy for everyone to relate to.
If you are familiar with my TechHelp series, you might recognize the TechHelp Free Template, which you can download from my website. For this example, I simplified the template by removing order details so all order totals are stored directly in the order table. Usually, you would calculate the total from related line items, but this makes the demonstration clearer.
So, in this scenario, each order has an ID, a customer (so we know which state they are in), an order date, and an order total.
Our first step is to create an intermediate query that gets just the year and month from each order date. If you group by the full date, you'll end up with a separate group for each day, which is generally not what you want. Instead, you want to summarize by month. To do this, create a query that includes the order date and the order total, then add a calculated field using the format function to extract the year and month. The resulting field is no longer a true date, it's just text representing the year and month, but that's fine for this purpose.
If you only needed monthly totals and nothing else, you could stop here and use an aggregate query to group by month and sum the sales. That will show you total sales across all customers for each month. However, to add more detail, you also want to include the customer's state. For that, you need to join the orders table to the customers table on the customer ID, and then bring in the state field. This gives you all the data you need: state, order month, and order total.
Now, you are ready to set up the cross tab query. Give your saved query a sensible name, such as "sales by month by state." By the way, I generally use "sales" in the plural for naming, as "sale" sounds odd in most contexts.
Access offers a cross tab query wizard, which I recommend for beginners. Some wizards in Access are decent while others are not, but the cross tab query wizard is helpful and makes the process easier. You can always tweak the results later in design view if needed.
To use the wizard, choose it from the query wizards menu, and start by selecting the previously created query as your data source. The wizard only allows you to choose one table or query, so it is important to have all fields combined in a single query first.
Next, choose which fields you want as the row headings, such as state. You can use multiple fields as row headings if you want more detail, breaking it down by country, then state, for example. After that, choose your column headings, which here is the order month.
For the values in your grid, Access defaults to averaging the order total. If you would rather see the actual sum, switch the function from "average" to "sum." Other options, like "count," can also be useful in other situations, such as counting the number of orders per state. For now, stick with summing the sales.
There's also an option to include row sums, which adds an extra column showing the total for each row (such as all months for a particular state). You can turn this on or off depending on your needs.
Once you're done, give the query a name, for example by adding a "Q" suffix, and finish. The wizard will generate the cross tab query and you can immediately see the results: a grid with states as rows, months as columns, and the summed sales as the values.
Some common follow-up questions arise after setting up a cross tab query. For example, you might want to show zeros instead of blanks when there are no sales in a particular period. You might also want to add criteria for filtering by paid orders. These topics are covered in more detail in my Access Expert Level 17 and 18 classes. Access Expert 17 covers not only archiving and union queries, but also an introduction to cross tab queries similar to this example. Expert 18 goes further and explains advanced options like using parameters in cross tab queries, finding unmatched records, and more. Check my website for links to those classes if you want to learn more.
That's a summary of how to use cross tab queries in Access to analyze your sales data by month and by state. I hope you found this Fast Tip helpful.
If you are interested in becoming a member, you can select from several different membership levels, each offering unique benefits. Silver members and up get access to extended cut TechHelp videos, monthly beginner classes, and more. Gold members can download all the sample databases and view the Code Vault, as well as submit TechHelp questions with higher priority and receive free expert classes. Platinum members get everything already mentioned, even higher question priority, and access to all my full beginner courses across a variety of subjects, plus free developer classes after completing the expert series.
My free TechHelp videos will always be available and as long as you keep watching, I will keep making them.
You can find a complete video tutorial with step-by-step instructions on everything discussed here on my website at the link below. Live long and prosper, my friends.Topic List Introduction to cross tab queries in Access
Comparison of cross tab queries and Excel pivot tables
Setting up sample sales data for summarization
Using calculated fields in queries
Formatting dates as year and month with the Format function
Creating a summary query for sales by month
Distinguishing between aggregate and cross tab queries
Joining multiple tables in a query (Orders and Customers)
Adding fields from related tables to a query
Building a query for sales by month by state
Using the Cross Tab Query Wizard in Access
Selecting row and column headings in the wizard
Choosing the aggregation function (Sum, Average, Count)
Naming and saving the cross tab query
Interpreting cross tab query results |