Data Bars
By Richard Rost

 2 years ago
Creating Excel-Like Data Bars in Microsoft Access
In this Microsoft Access tutorial, I'm going to teach you how to create data bars, just like in Microsoft Excel, using conditional formatting. We will also learn how to get the data bars to refresh themselves automatically whenever you change any one value, instead of having to reload the entire form.
Prerequisites
Recommended Courses
Colored Data Bars Series
Keywords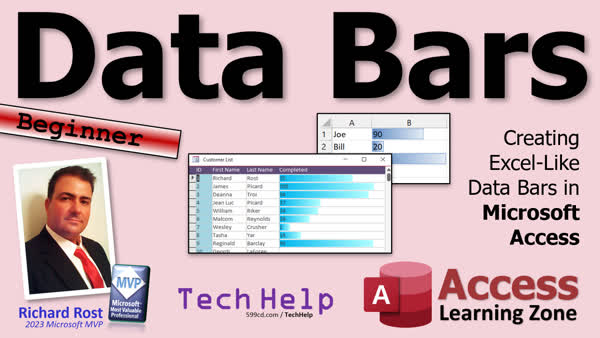
TechHelp Access, Creating Data Bars, Access Conditional Formatting, Excel-style indicators, Auto-refresh Data Bars, Access Form Enhancements, Dynamic Data Bars in Access, Visual Data Representation
 Subscribe to Data Bars
Get notifications when this page is updated
Transcript I've got a little mini three-part series for you. We're going to do data bars, color scales, and then colored data bars.
All right, what's all this stuff mean? Well, data bars are really easy to implement. I'm going to show you both Excel and Access. Basically, you've got a value here in a cell or field, and if it's a big value, like 100, it goes all the way over here. If it's a short value, like one, it's really small over there. That's a data bar. Pretty easy to do. That's what we're going to cover today.
Next up is color scales. Now, a color scale is basically: low values get one color, like red, and high values get another color, like green. In the middle, you might have yellow, or it could be reversed. This is very easy to implement in Excel but not so easy to implement in Access, especially if the max and min values can change. This is going to be a challenge. We'll do this in tomorrow's video.
The big one coming up on Friday is colored data bars. Now, this is something that you can't easily do in Excel. So, there you go, Excel users. I've got something that's actually easier to do in Access. You can do data bars, and you can do color scales, but you can't do colored data bars. We'll talk about this on Friday.
But for today, let's do data bars. Now, let's see data bars in Excel first.
All right, here I am over in Excel. I've got Joe, Bill, Sue, and Bob, and there are some values there. I want a data bar over here so that the big values, like 130, come all the way across, and the small values, like four, have a really short bar. This is just a matter of conditional formatting, and it's easy to set up in both Excel and Access. It's pretty much the same thing.
Come over here, conditional formatting, data bars, and then just pick what you want. There are different fills that are available: the transparent ones and the solid ones. I like the gradient ones, that's all. All right, like that one there. Pretty straightforward. If these values change, if that becomes 45, the bar gets longer. Easy enough.
All right, how do I do this in Access? Let's say on my customer list, I want to do a little data bar. Let's make a field called "completed" or whatever. Let's say you're doing what percentage of something is complete or whatever, any value you want. Let's just call it "completed."
All right, we'll make this a number. It doesn't have to be a percentage. It could be a number from five to 50 or whatever. Save that. Let's go into my customer list form here. This is a continuous form.
If you've never seen me build these before, go watch my TechHelp free template video. You'll find a link down below.
I'm going to get rid of this stuff here. We don't need all of that. Let's drop in existing fields and bring our "completed" over here. There it is. All right, there's "completed." We'll make it nice and big so we have room for the bar.
Of course, my little label copy-paste. Stick that there. Completed. Let's see what we're dealing with. I'm going to make sure this is left-aligned also.
All right, let's put some values in here: 130, 85, 40, and 2.
Now let's put data bars in there. Right click, Design View. Again, we're going to go up to Conditional Formatting. If you've never done any conditional formatting before, go watch my conditional formatting video to get the basics. I'll put a link to that down below in the links section under the video. Watch that for more information.
We are going to click on New Rule. You have two options here: check the values in the current record using an expression, or compare to other records. That's the only one I want to pick right there.
You have data bar formats. "Show bar only" means you don't want to see the value that's in the bar, but I want to see both.
The shortest bar, we're going to use the lowest value. The longest bar, we're going to use the highest value. This way, your scale doesn't matter. If it goes from 1 to 100, that's great. If it goes from 50 to 212, that's great. The bar will adjust accordingly.
Pick your bar color. I'll go with that guy there. Now it's a little darker. Maybe that. OK, ready? Hit OK. That's what it's going to look like. Hit OK. Save it. Close it. Open it. Boom. There's your data bars.
If the number is hard to see, you can right-align the number if you want to. Come over here. Align it right or even center it. Put it in the middle of the bar. Whatever you want. Or you can do two fields: one with just the number, and one with the bar itself like this.
Watch this. Let's say I'm going to take this guy. Let's go back to left align. I'm going to copy this, copy-paste. Let me turn off the conditional formatting in the second one. Come in here and delete that rule, and then shrink it down and stick it here. Then we'll take this guy and put it next to it like that.
In here, we'll go to conditional formatting, edit the rule, and show bar only. That's why this isn't here. Then you can get an idea for the data bar size without interfering with the number. Save it. Close it. Open it. There you go.
So that's pretty straightforward. That's pretty easy to do. That's data bars. If these values change and it becomes 200, well, now that's the long guy.
I just had to prove that to myself a minute ago. I did that, and it got shorter, but watch what happens if you exit and come back in. It redraws all these when the form loads. So if you change it to 200 and move off of it, that one got really long, but these guys should have gotten shorter. So you have to close it and then reopen it again.
Or if you want, you could put an After Update event in here to refresh this guy. Want a little VBA? A little sneak of VBA in here?
Here. Design View. This guy. Let's go to the events for this thing. Close this. Bring up its properties. Go to Events. Go in it.
Let me see here. This one. See, this one's named "completed" because that's the first one we put in there, and this guy is "Text22" because we copied it, even though they're both bound to the same thing. I'm going to make this guy... let's rename this one to "CompletedBar" and this guy will just be "Completed," like that.
Now I can say in your After Update event (After Update runs when this guy is changed) you can come in here. There's a million things you could do. You could try different stuff. You could just come in here and say Me.Refresh. That might redo all the bars.
Let's see. Let's give it a shot and see.
Let's say I come in here and make this a two and hit Tab. Look at that, it updated all the bars. Now if I come in here and make this 2000, Tab. Look at that.
Normally, these just refresh when the form loads, but with one line of VBA code, you can make it do all kinds of cool stuff. If you've never done any VBA programming before and you want to learn, go watch this. It's about 20 minutes long. It'll get you started. VBA is not hard, and just learning a tiny bit can make your databases do all kinds of cool stuff.
So this is data bars. Let's put that back at a reasonable number.
If you want to learn more about data bars in Excel, I actually covered it in my Beginner Level 2 class. I got to it right away in Excel. It's super easy to do in Excel. You saw how easy that was right now, all your scales and data bars. That's Excel Beginner Level 2.
In Access, I waited all the way up until Expert Level 19. This is a pretty high-level class because honestly, I don't use it that much in Access. Here they are here. I think it was just kind of like I mentioned, like an "oh, by the way, you can put data bars in here like Excel." It's not something that I use a lot in Access, but some people have asked me recently how to do it, so that's why I'm putting this video together.
All right, so that's data bars. Tomorrow, we're going to do color scales. Very easy to do in Excel, not so easy to do in Access.
Then on Friday, we're going to make some together and have color scales and data bars. They're going to do all kinds of cool stuff. So stick around.
That is going to be your TechHelp video for today. I hope you learned something, my friends.
Live long and prosper. I'll see you next time.Intro In this video, we will look at how to use data bars in both Microsoft Excel and Microsoft Access to visually represent numeric values in your data. I will show you how to set up data bars using conditional formatting in Excel, and then walk you through adding data bars to fields in an Access continuous form, including tips for displaying the data and a simple way to refresh the bars with a bit of VBA code.Quiz Q1. What is the primary function of data bars in Excel and Access?
A. To display a graphical indicator of a value's magnitude in relation to other values
B. To sort data in descending order automatically
C. To highlight duplicate values in a dataset
D. To convert text values into numbers
Q2. How are data bars implemented in Excel?
A. Through cell references
B. By using formulas only
C. With conditional formatting settings
D. By inserting a chart for each cell
Q3. In Excel, what determines the length of a data bar in a cell?
A. A fixed maximum value preset by the user
B. The value of the cell relative to other cells in the range
C. The total number of records in the column
D. The type of data (text or number) in the cell
Q4. When adding data bars in Access using conditional formatting, which option compares a record's value to the rest of the data?
A. Use an expression for current record only
B. Compare to other records in the dataset
C. Apply only to empty fields
D. Use formula to calculate position
Q5. What does checking the 'Show bar only' box in data bar conditional formatting do?
A. Shows only the data bar and hides the numerical value
B. Displays the highest value in bold font
C. Shows both the data bar and the value
D. Aligns the bar to the right of the cell
Q6. What must you do in Access after changing a value to see all data bars update immediately, without closing and reopening the form?
A. Apply a macro that refreshes the field
B. Run a filter on the form
C. Use VBA code in the After Update event to refresh the form
D. Save and reopen the database
Q7. Which feature is easier to implement in Excel but challenging in Access, especially when minimum and maximum values can change?
A. Data bars
B. Color scales
C. Colored data bars
D. Sorting and filtering
Q8. What is a practical way in Access to display both the number and a data bar without overlap?
A. Show only the bar in all fields
B. Create two fields: one for the value, one for the bar
C. Only use conditional formatting on the label
D. Use a chart embedded in the form
Q9. What is the main benefit of using even a small amount of VBA code in Access forms, as described in the video?
A. It allows the database to generate random values
B. It can automate the refresh of visual elements like data bars after an update
C. It disables all other formatting rules
D. It makes labels change colors automatically
Q10. Which of the following is NOT true based on the video?
A. Data bars are straightforward to set up in both Excel and Access
B. Conditional formatting enables data bars in both programs
C. Colored data bars are easier to create in Excel than Access
D. Small amounts of VBA can enhance Access form interactions
Answers: 1-A; 2-C; 3-B; 4-B; 5-A; 6-C; 7-B; 8-B; 9-B; 10-C
DISCLAIMER: Quiz questions are AI generated. If you find any that are wrong, don't make sense, or aren't related to the video topic at hand, then please post a comment and let me know. Thanks.Summary Today's TechHelp tutorial from Access Learning Zone focuses on data bars. This is the first lesson in a short three-part series covering data bars, color scales, and then colored data bars.
Let me start by explaining what data bars are. The idea is straightforward: you have a field or a cell with a value, and the higher the value, the longer the bar displayed next to it. If you have a high number, the bar stretches further; with a smaller number, the bar is short. Data bars provide a nice visual indicator for your data, and they are quite simple to set up.
Today we will work through the steps in both Microsoft Excel and Access.
To begin with Excel, imagine you have a sheet listing several people, each with a numerical value. The goal is to have a bar next to each value, so the largest value fills the longest bar and the smallest value, the shortest. Thankfully, conditional formatting in Excel makes this incredibly easy. You can use data bars with either a transparent or a solid fill. I personally prefer the gradient style, as it is simple and visually pleasing. As your values change, these bars update automatically. For example, if you change a value from 25 to 45, the associated bar lengthens right away.
Now, let me explain how to achieve data bars in Access. Let's suppose you want to visualize a "completed" field on a customer list form. You would start by adding this field to your table, and it can be any numeric type or even a percentage. In the form's design, you would then add the "completed" field so you have room to display the data bar. After entering a few sample values, such as 130, 85, 40, and 2, you are ready for formatting.
To apply data bars in Access, you use Conditional Formatting on the field in your continuous form. You create a new rule to compare each record to the others. There are options to display only the bar, but often it is useful to show both the value and the bar together. By setting the shortest bar using the lowest value and the longest by the highest value, your scale will automatically adjust regardless of your data range. Once you choose your preferred color for the bars, you save and view the form, and the data bars appear as expected.
If you find the value hard to read on top of the bar, you can adjust the alignment or split the display into two separate controls – one showing only the value and the other showing only the data bar. This gives you flexibility in how you present your data. You simply copy the control, remove the conditional formatting rule from one, and set the other to show the bar only. Align these side by side to create a clear visual.
You may notice that updates to values do not always refresh the bars immediately. Typically, Access redraws the data bars when the form reloads, so you may need to close and reopen the form to see updates. However, you can add a small bit of VBA code to the control's After Update event. All you need is a line to refresh the form, and as soon as you change a value and press Tab, all the bars update right away. Even just learning a touch of VBA can give you a lot of extra power in Access forms.
For those interested in where to learn more, I cover data bars in Excel very early, in my Beginner Level 2 class, since Excel makes this task quite simple. In Access, I do not introduce it until my Expert Level 19 course, mostly because it is not a feature I use often in Access, but it is good to know it is available if you need more visual feedback in your forms.
This wraps up our lesson on data bars. Keep an eye out for tomorrow's video, when I will show you how to use color scales. Color scales are quick to implement in Excel, but pose a bigger challenge in Access. Then, in the final video of the series, I will demonstrate how to create colored data bars, which is a little trickier and something Excel cannot do as easily as Access.
If you want step-by-step instructions, you will find the full video tutorial on my website at the link below.
Live long and prosper, my friends.Topic List Implementing data bars with conditional formatting in Excel
Choosing data bar fill types in Excel
Adjusting Excel data bars for changing values
Creating a number field for data bars in Access
Adding a "completed" field to an Access form
Displaying data bars in continuous Access forms
Applying conditional formatting for data bars in Access
Comparing current record values for data bars in Access
Customizing data bar color in Access
Configuring minimum and maximum data bar scaling in Access
Showing or hiding bar values in Access data bars
Aligning numbers within Access data bar fields
Displaying bars and values in separate Access fields
Refreshing Access data bars with After Update event
Using Me.Refresh VBA to update Access data bars
Renaming and organizing Access form controls for data barsPrimary Topics data bars, conditional formatting, Excel, Access, continuous forms, form customization, value visualization, refreshing forms, basic VBA
Secondary Topics field alignment, separating bar and value, color options, none
|